1. Collecting and classifying data
Sorting data before displaying it
- Discrete data can be counted and takes only separate values, such as the number of pets or a shoe size
- Continuous data is measured and can take any value in a range, such as a height or a time
- Categorical data is not numerical at all, such as a colour or a favourite subject
- A tally chart records data as it is collected, in groups of five, and becomes a frequency table once the tallies are counted
- A two-way table cross-classifies by two characteristics at once, with the row and column totals as a built-in check
- The type of data decides which diagram is appropriate, which is why classifying comes first
2. Bar charts and pictograms
Bar charts
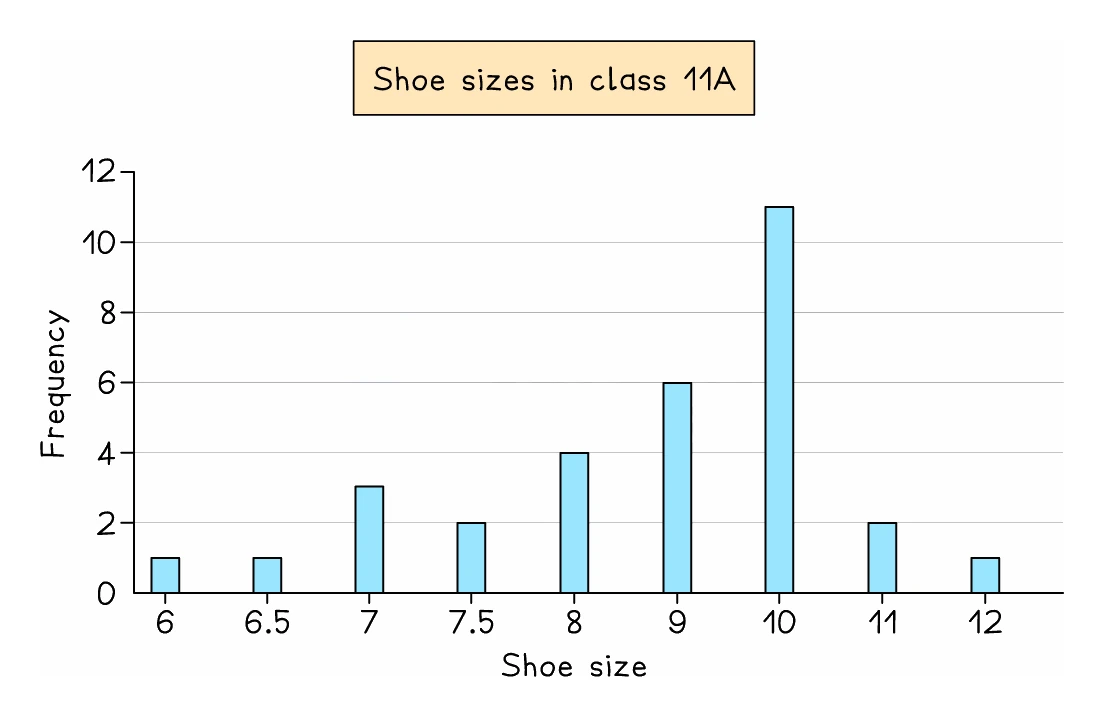
- A bar chart shows discrete or categorical data, with the categories along the bottom and the frequency up the side
- Bars are drawn with equal widths and with gaps between them, which is what distinguishes a bar chart from a histogram
- The tallest bar gives the mode
- The syllabus names two variants
- A dual bar chart puts the bars for two data sets side by side for each category
- A composite or stacked bar chart stacks the parts of each bar on top of one another, so the total height is the combined frequency, or 100% when each bar shows percentages
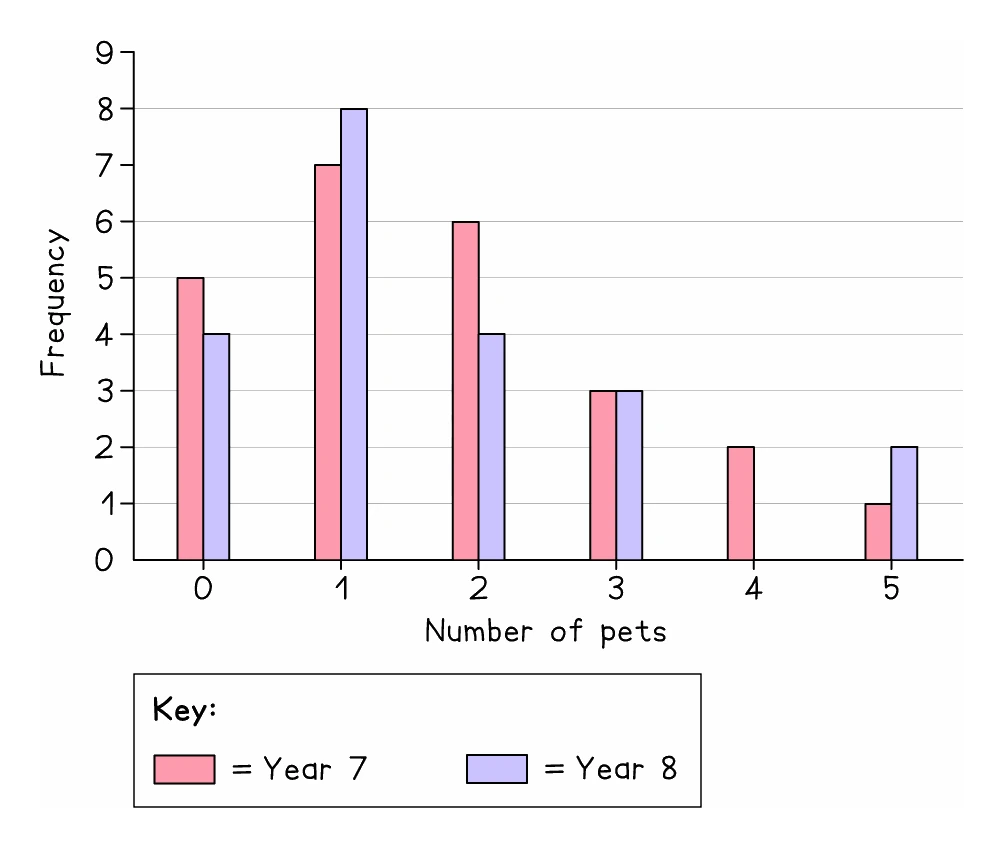
- When drawing one, pick a scale from the largest frequency so that it fits the space given
Worked example
Reading a composite bar chart
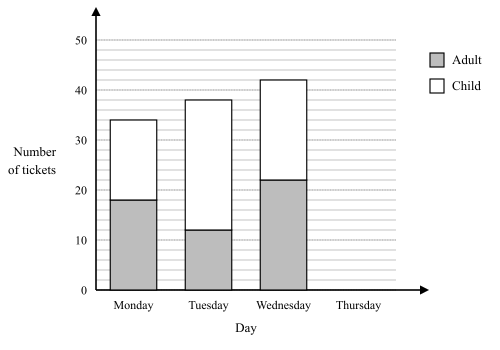
A cinema sells adult and child tickets. The composite bar chart shows how many of each it sold on Monday, Tuesday and Wednesday, with the adult part at the bottom of each bar. (a) On which day were the most child tickets sold? (b) On Thursday the cinema sold 40 tickets, and 16 of them were adult tickets. Draw the bar for Thursday.
Solution:
- Each part of a bar starts where the part below it ends, so its value is the reading at its top minus the reading at its bottom
- (a) Child tickets: Monday 34 − 18 = 16, Tuesday 38 − 12 = 26, Wednesday 42 − 22 = 20
- The most child tickets were sold on Tuesday, with 26
- Wednesday has the tallest bar, but its height of 42 is both parts together, not the child tickets alone
- (b) Draw a bar as wide as the others, shaded like the key's adult square from 0 up to 16, then unshaded from 16 up to 40 for the 24 child tickets
- If the axis carried no numbers, a fact in the question would fix the scale first: had Monday's adult part been 9 gridlines high and worth 18 tickets, each gridline would be 18 ÷ 9 = 2 tickets
Pictograms
- A pictogram replaces bars with symbols, and a key states how many one whole symbol represents
- Part-symbols show part-values, so with a key of one symbol representing 4 people, three and a half symbols means 14
- Read the key before anything else, since the same picture means different amounts on different questions
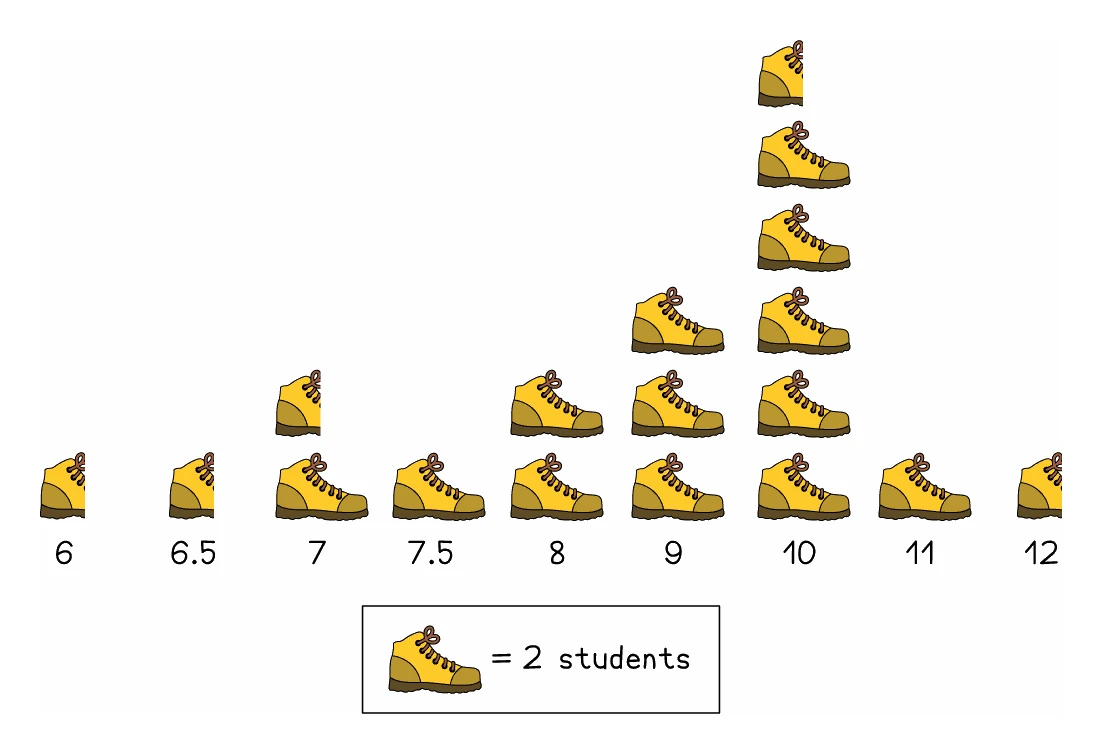
- Choose an easy symbol to draw and halve if you are asked to make one
Worked example
Reading a pictogram
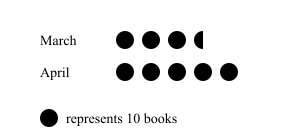
On a pictogram of books read, one symbol represents 10 books. March shows 3 whole symbols and one half symbol. April shows 5 whole symbols. How many books were read in each month, and how many more in April?
Solution:
- Read the key first: every whole symbol stands for 10 books, so a half symbol stands for 5
- March: 3 × 10 = 30, plus the half symbol worth 5
- March = 35 books
- April: 5 × 10 = 50 books
- Difference = 50 − 35 = 15 more books in April
- Counting symbols instead of reading the key would have given 3.5 and 5, which are not numbers of books at all
3. Pie charts
Drawing one
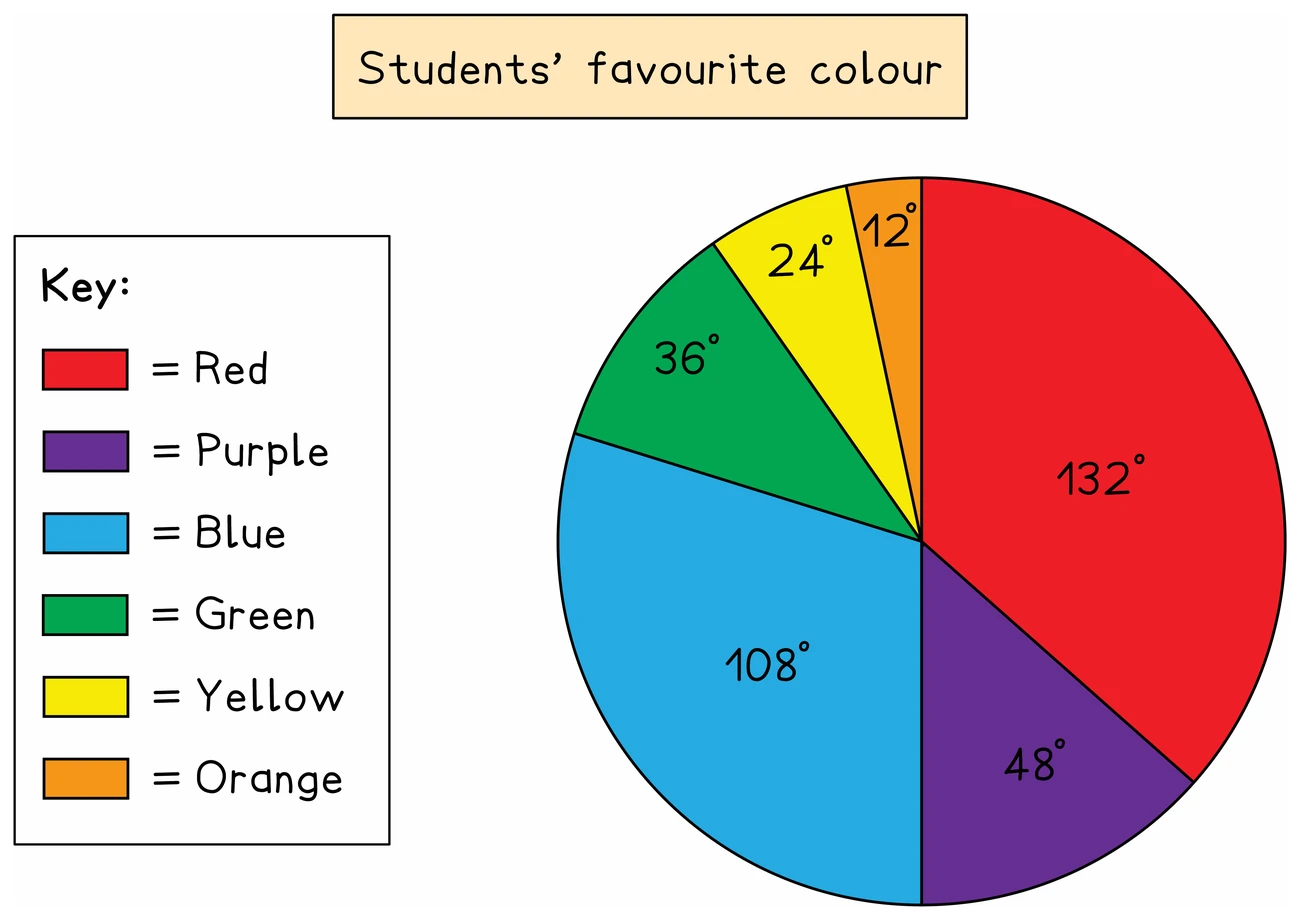
- A pie chart divides a circle into sectors, one for each category, showing the proportions rather than the actual frequencies
- Each sector angle is that category's share of the whole turn
- Angle = (frequency ÷ total frequency) × 360°
- Work out every angle, then check they add to 360° before drawing anything
- Draw with a protractor from a radius already drawn, measuring each angle from the previous boundary
- Label every sector or provide a key
Reading one
- Going the other way, frequency = (angle ÷ 360°) × total frequency
- A sector's angle alone cannot give a frequency without the total, which is why, when two pie charts show different totals, a larger sector does not have to mean a larger frequency
Exam tip
Write the angles before you draw
Completing a pie chart earns marks for the angles you work out and separate marks for the sectors you draw. The sectors are checked against your angles, so a wrong angle drawn accurately can still earn a drawing mark. That needs your angles on the page: write each one in the table or beside the chart before you draw any sector.
Worked example
Calculating pie chart angles
Forty people are asked their favourite drink. The table shows the results. Work out the angle of each sector for a pie chart.
| Favourite drink | Tea | Coffee | Juice | Water |
|---|---|---|---|---|
| Number of people | 14 | 12 | 9 | 5 |
Solution:
- Each angle is the category's share of 360°
- With 40 people, one person's share is 360 ÷ 40 = 9°, which is the same as working out frequency ÷ 40 × 360 for each drink but needs no calculator
- Tea: 14 × 9 = 126°
- Coffee: 12 × 9 = 108°
- Juice: 9 × 9 = 81°
- Water: 5 × 9 = 45°
- Check: 126 + 108 + 81 + 45 = 360
Worked example
Finding a frequency from a pie chart
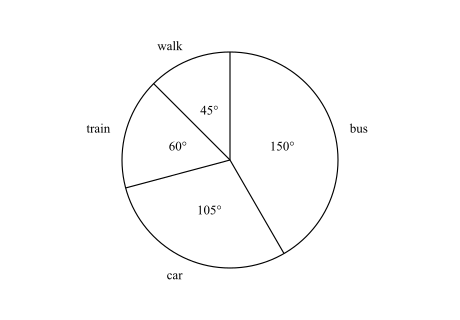
The pie chart shows how the members of a walking club travel to a meeting. Its sector angles are bus 150°, car 105°, train 60° and walk 45°. 18 more members travel by bus than by train. (a) How many members walk? (b) How many members are in the club? (c) How many members travel by car?
Solution:
- Each sector's number of members is in proportion to its angle, so first find what a known number of degrees is worth
- The total is not given, but a difference is: bus − train = 150° − 60° = 90°, and that is 18 members
- (a) The walk sector, 45°, is half of 90°, so 9 members walk
- (b) The whole circle, 360°, is 4 × 90°, so the club has 4 × 18 = 72 members
- (c) Now the total is known: frequency = (angle ÷ 360°) × total frequency, so car = 105 ÷ 360 × 72
- With no calculator, each member's share is 360 ÷ 72 = 5°, so car = 105 ÷ 5 = 21 members
- Check: bus = 150 ÷ 5 = 30 and train = 60 ÷ 5 = 12, which differ by 18, and 30 + 21 + 12 + 9 = 72
4. Stem-and-leaf diagrams
Structure and key
- A stem-and-leaf diagram displays the actual data values while also showing their shape
- Each value splits into a stem, usually the tens digit, and a leaf, usually the units digit
- The syllabus requires the data to be ordered and the diagram to carry a key
- The key states what a particular stem and leaf combination represents, including units, such as 2 | 3 represents 23 g
- Other splits are possible, so a key might make 2 | 3 mean 2.3 or 2300, and reading it is essential
Using one
- Because every value is still visible, the median, mode and range can all be read off directly
- Count the leaves in order to find the median position, working along the rows from the top
- The range is the largest value minus the smallest, both of which sit at the ends
- Questions also run backwards, giving the median, mean or range and asking for missing leaves
Exam tip
Put the leaves in order
Completing a stem-and-leaf diagram from a list is worth two marks, and a diagram with every value in its right row but the leaves out of order earns only one. So draft it first: go along the list once, writing each leaf beside its stem and crossing the value off, then copy each row into the diagram with its leaves from smallest to largest. Count the leaves: one for every value in the list.
Worked example
Reading a median off the leaves
The stem-and-leaf diagram shows ten values. Find the median and the range.
| Stem | Leaf |
|---|---|
| 2 | 3 5 |
| 3 | 1 4 4 8 |
| 4 | 2 5 7 |
| 5 | 1 |
Key: 2 | 3 represents 23
Solution:
- The values in order are 23, 25, 31, 34, 34, 38, 42, 45, 47, 51
- There are 10 values, an even number, so the median is midway between the 5th and 6th
- The 5th value is 34 and the 6th is 38
- Median = (34 + 38) ÷ 2 = 36
- The range is the largest minus the smallest: 51 − 23 = 28
5. Comparing and interpreting
Drawing conclusions properly
- Comparing two data sets needs both an average and a measure of spread, and a comparison using only one of them is incomplete
- Say what the comparison means in the context of the question rather than only quoting numbers
- The syllabus asks you to appreciate the restrictions on what data can show
- A small sample may not represent the whole population
- A diagram showing proportions, such as a pie chart, hides the actual totals
- A correlation between two things does not establish that one causes the other
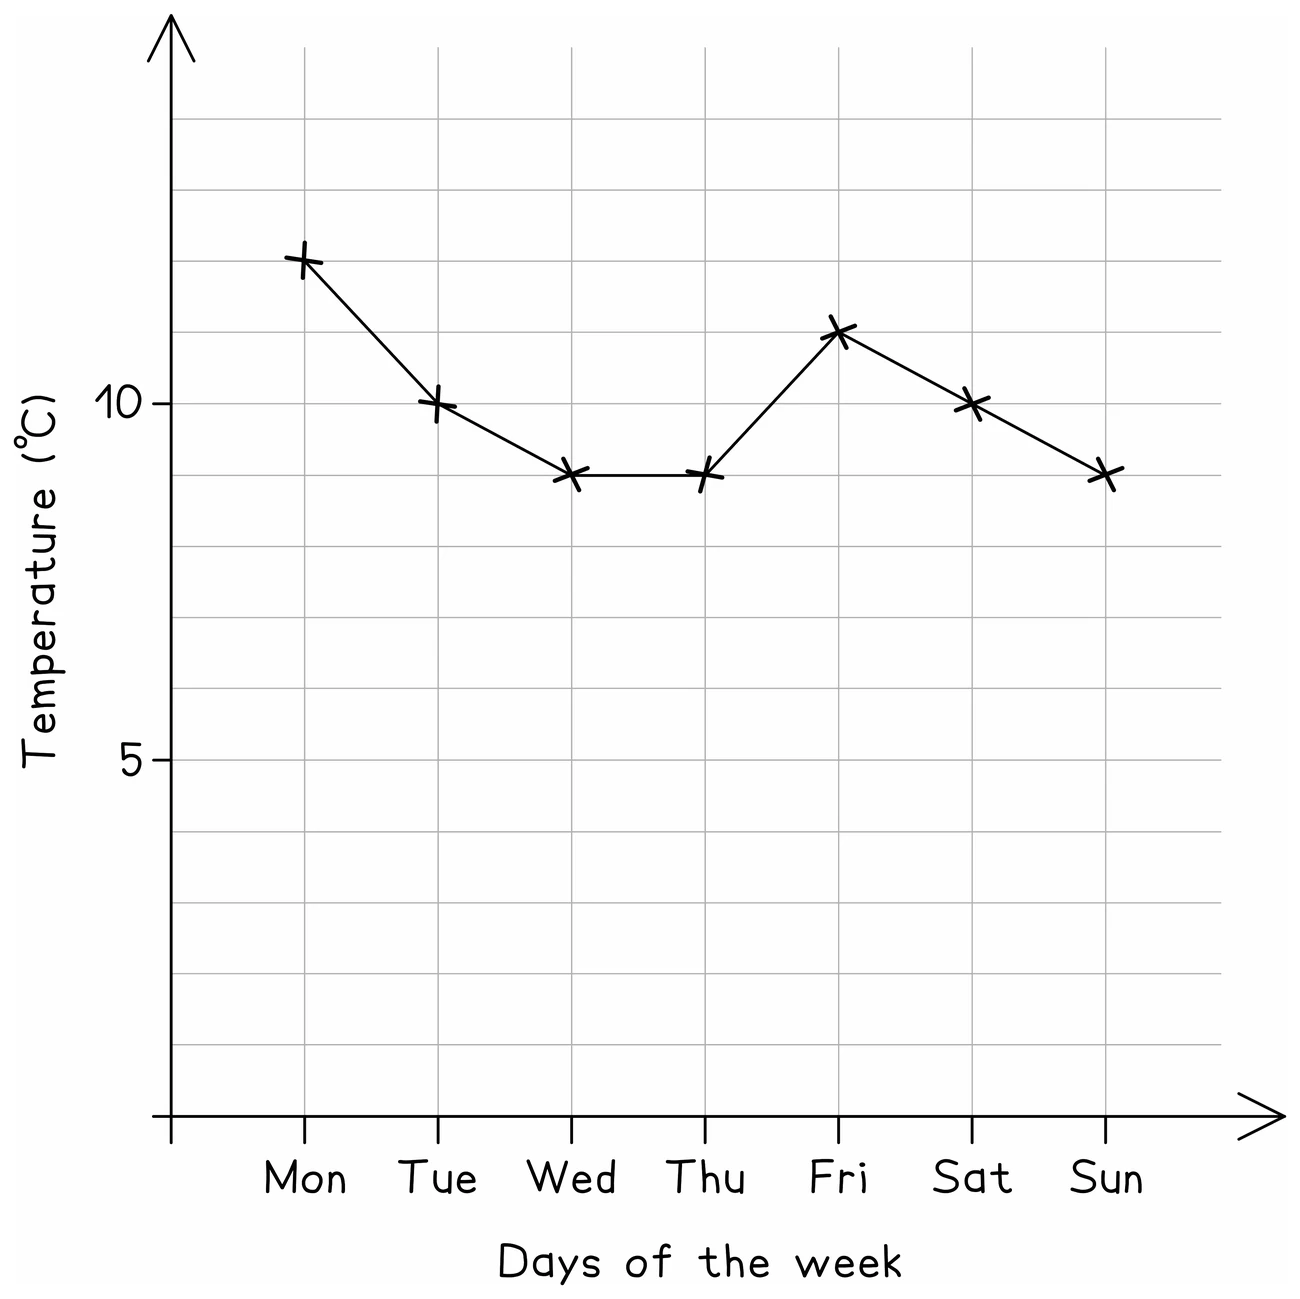
- Check the scale on any printed diagram before reading values, since axes do not always start at zero
Worked example
Comparing two sets properly
Class A has median 62 marks and range 30. Class B has median 55 marks and range 12. Compare the two classes.
Solution:
- A comparison needs one statement about average and one about spread, each interpreted in context
- The medians: 62 is higher than 55
- In context: on average, Class A scored higher marks than Class B
- The ranges: 30 is larger than 12
- In context: Class B's marks were more consistent, because a smaller range means the marks were closer together
- Writing only "A's median is 62 and B's is 55" lists the numbers without comparing them: say which is higher, name the measure, and say what it means for the two classes