Set Notation and Probability Diagrams
Mathematics (Core) revision notes · Cambridge (CIE) · 0580 · Core
1. Sets and their elements
Describing a set
- Any well-defined group of things forms a set, and each thing belonging to it is an element of that set
- Elements can be anything: numbers, letters or objects
- Writing the elements inside curly brackets defines a set directly
- The factors of 12 form the set {1, 2, 3, 4, 6, 12}
- A rule can replace the list, written with a colon read as "such that"
- {x : x is an integer, 1 ⩽ x ⩽ 5} is another way of writing {1, 2, 3, 4, 5}
- Capital letters name sets and lower-case letters name elements
The universal set
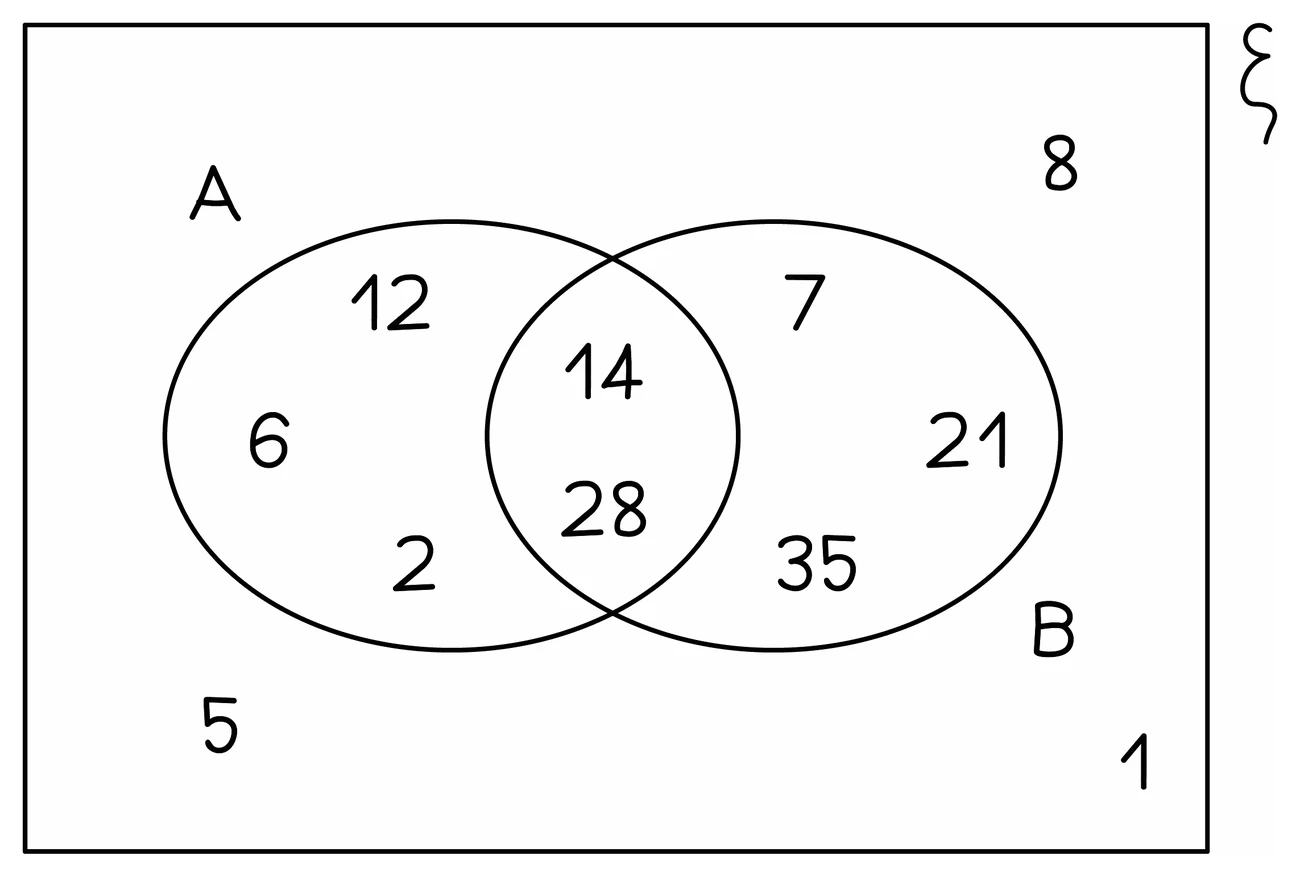
- The universal set holds everything under consideration in that question, and this specification writes it as ℰ, a script capital E
- Every other set in the question is contained within it
- Other material uses the Greek letter xi, ξ, or the letter U for the same thing, and the diagram below is labelled that way, but ℰ is the symbol the syllabus lists and the one printed on these papers
2. The notation
Symbols required by the specification
| Symbol | Meaning |
|---|---|
| n(A) | The number of elements in A |
| A′ | The complement of A: everything in ℰ that is not in A |
| ℰ | The universal set |
| A ∪ B | The union of A and B |
| A ∩ B | The intersection of A and B |
- Union collects everything appearing in either set, or in both, and each element is written once
- Intersection keeps only what appears in both sets
- The complement is found by taking the universal set and removing the named set
Worked example
Reading set notation
ℰ = {x : x is an integer, 1 ⩽ x ⩽ 10}, P = {2, 3, 5, 7} and Q = {1, 3, 5, 7, 9}. Write down n(P), P ∩ Q, P ∪ Q and P′.
Solution:
- n(P) counts the elements of P, so n(P) = 4
- P ∩ Q keeps only what is in both: {3, 5, 7}
- P ∪ Q collects everything in either, listing each once: {1, 2, 3, 5, 7, 9}
- P′ removes P from the universal set: {1, 4, 6, 8, 9, 10}
3. Venn diagrams
How the diagram is built
- A Venn diagram shows sets as circles inside a rectangle, where the rectangle is the universal set
- Overlapping circles share the elements that lie in both sets
- Anything belonging to no named set is written inside the rectangle but outside every circle
- This specification limits Venn diagrams to two sets
Regions and operations
- Each operation corresponds to a region of the diagram, which is what makes the notation easy to apply
- The union covers both circles entirely; the intersection covers only the overlap
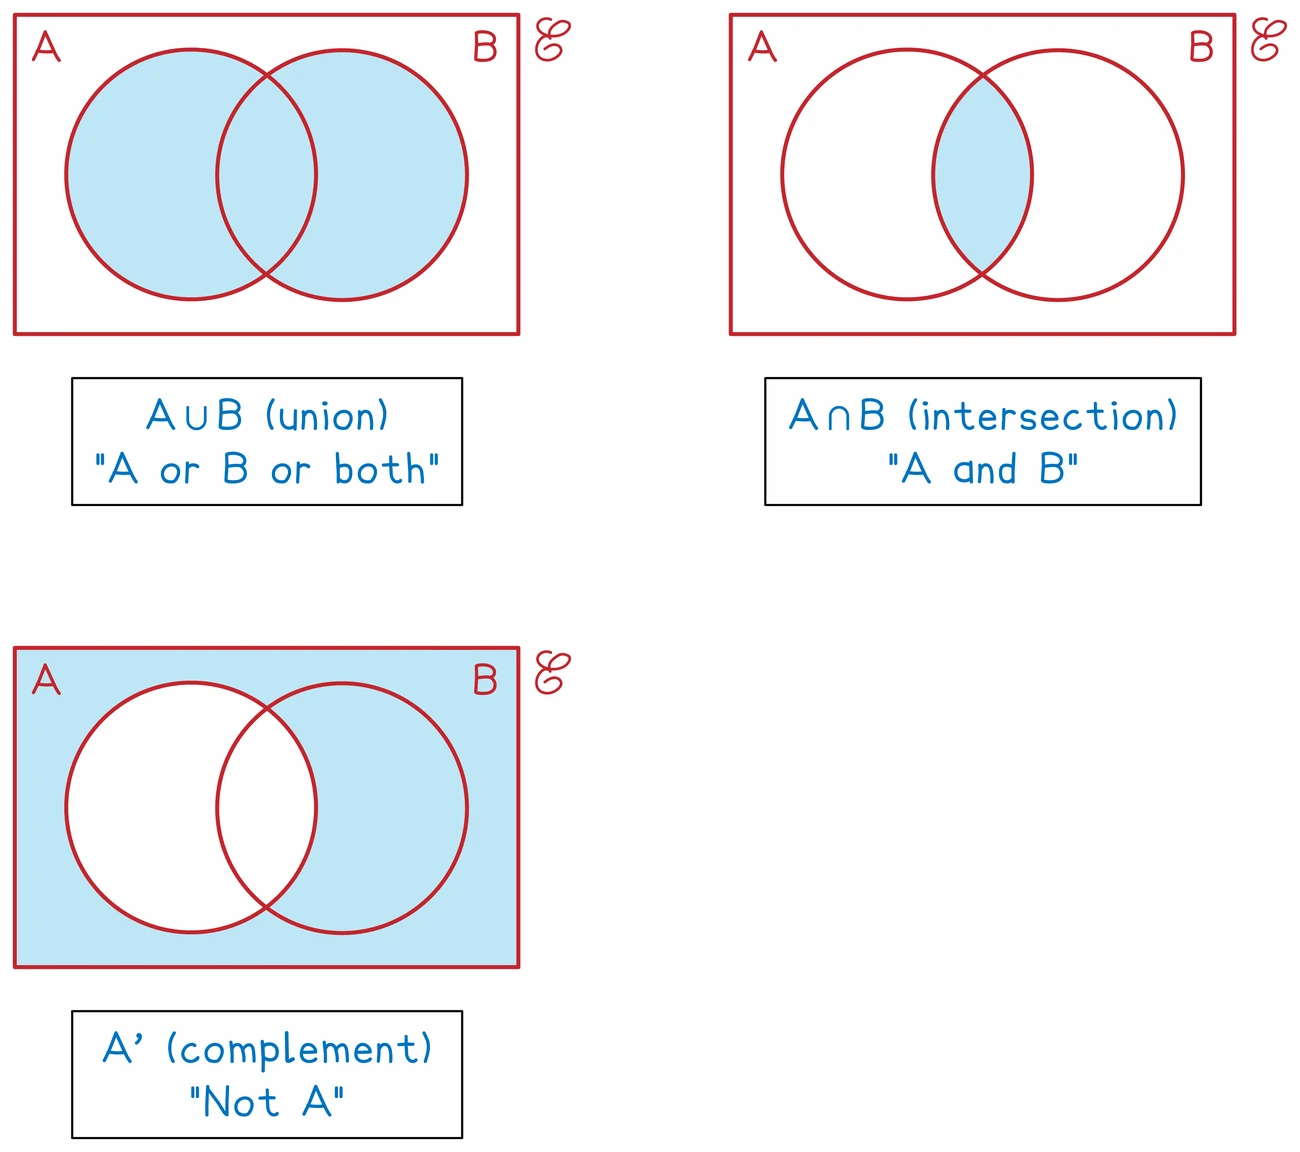
- A complement shades everything outside the named set but still inside the rectangle
- Combined expressions are read from the inside out, so (A ∪ B)′ means shade everything the union does not cover
Counting from a diagram
- n(A) counts every element inside circle A, including those in the overlap
- Elements in the overlap belong to both sets and are counted once in a union
Exam tip
Fill every region first
The parts after a Venn diagram, such as n(A ∩ B), a list or a probability, are usually marked from your own diagram, so a slip in the diagram need not cost them as well. That follow-through needs something written in each region the answer uses, so fill every region before you move on, then read each answer off your diagram rather than working it out again from the question.
Worked example
Placing elements in a Venn diagram
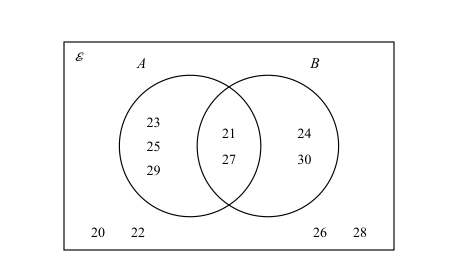
ℰ = {x : x is an integer, 20 ⩽ x ⩽ 30}, A = {odd numbers} and B = {multiples of 3}. Show A and B on a Venn diagram, then find n(A ∪ B) and list the elements of A′.
Solution:
- List each set from ℰ first: A = {21, 23, 25, 27, 29} and B = {21, 24, 27, 30}
- Fill the overlap first: 21 and 27 are both odd and multiples of 3
- A only: 23, 25, 29; B only: 24, 30
- Outside both circles, inside the rectangle: 20, 22, 26, 28
- Check the count: 3 + 2 + 2 + 4 = 11, and ℰ holds the 11 integers from 20 to 30, so each is placed exactly once
- A ∪ B covers both circles, so n(A ∪ B) = 3 + 2 + 2 = 7, with 21 and 27 counted once
- A′ is everything in ℰ outside circle A: {20, 22, 24, 26, 28, 30}
Worked example
Counting from a Venn diagram
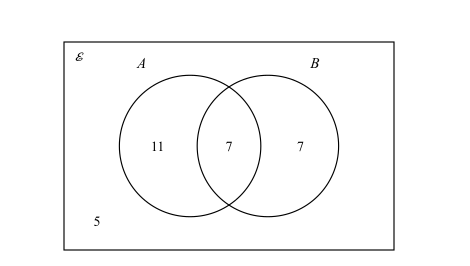
In a group of 30 students, 18 study art (A) and 14 study biology (B). 7 study both. Show this on a Venn diagram, then work out how many study neither.
Solution:
- Fill the overlap first, because the two given totals each already include it
- The intersection holds 7
- Art only = 18 − 7 = 11
- Biology only = 14 − 7 = 7
- Those three regions hold 11 + 7 + 7 = 25 students
- The universal set holds 30, so the region outside both circles holds 30 − 25 = 5
- Check by adding all four regions: 11 + 7 + 7 + 5 = 30
- Writing 18 in the art circle and 14 in the biology circle would count the 7 twice and total 39
4. Combining two events
The two rules
- Where two things happen one after the other, two rules cover almost everything
- "And" means multiply, so the probability of A happening and then B is P(A) × P(B), where P(A) is short for the probability of A
- "Or" means add, so the probability of one case or another, when the two cannot both happen, is the sum of their probabilities
- Rephrasing a question in terms of "and" and "or" first is what turns it into a calculation
- "Both counters are red" is red and red
- "One of each colour" is red and blue or blue and red
- The probability of all the possible cases together is 1, which is a quick check on any full list
- Where a question asks for at least one, it is usually faster to work out the probability of none and subtract from 1
Independent events
- Two events are independent when the first does not change the second
- With replacement means the item goes back, so the bag is the same for the second pick and the two probabilities are equal
- These papers combine events with replacement only, so the result of the first stage never changes the probabilities for the second
- Keeping fractions unsimplified while working makes them far easier to add at the end
Worked example
Two picks with replacement
A bag holds 5 red counters and 7 blue counters. A counter is taken at random, its colour is recorded, and it is put back. A second counter is then taken. Find the probability that both are red.
Solution:
- There are 5 + 7 = 12 counters, so the first pick is red with probability 5/12
- The counter goes back, so the bag is unchanged and the second pick is red with probability 5/12 as well
- "And" means multiply, so P(red then red) = 5/12 × 5/12
- P(red then red) = 25/144
5. Tree diagrams
Building one
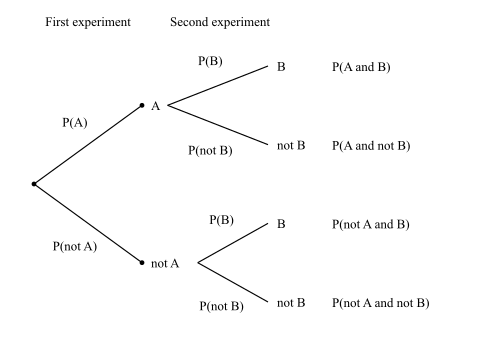
- A tree diagram sets out two or more stages, with a branch for each outcome at each stage
- The syllabus states the convention these papers follow: outcomes at the ends of the branches, probabilities beside them
- Each pair or group of branches from one point must add to 1, which fills in any missing probability
- When a question prints a tree diagram, it asks you to complete it first, and that alone carries marks
Reading one
- Follow one complete route across the diagram and multiply the probabilities you pass, which gives that path its own probability
- Add between separate paths when more than one outcome satisfies the question
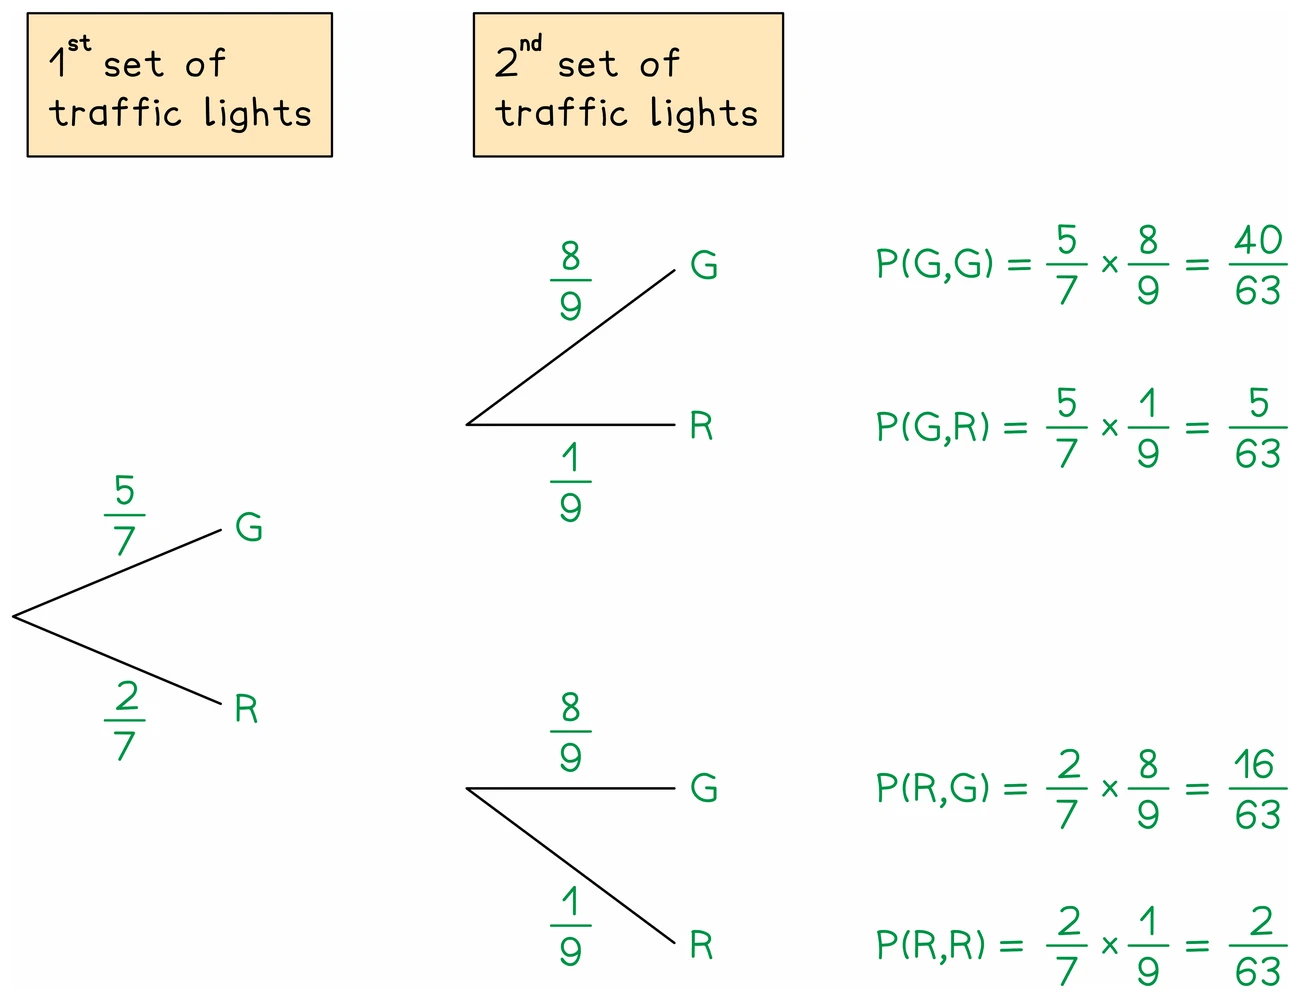
- The probabilities of all the complete paths add to 1
- In these papers the first stage never changes the second, so each second pair of branches carries the same probabilities whichever first branch it follows: the first pair again when one spinner or bag is used twice, or a new pair for a different event, like the second set of traffic lights above
Exam tip
Multiply the values on your tree
The probability of a route is marked from your own tree: writing the multiplication with the values on your branches, such as 3/8 × 3/8 below, earns the method mark even if one of them is wrong. So always write that line before the answer. It counts only while each value is a probability between 0 and 1, so a branch value such as 8/3 is a slip to fix first.
Worked example
Two spins on a tree diagram
A spinner has 3 red sections and 5 blue sections, all the same size. It is spun twice. Find the probability that both spins are red, and the probability that exactly one spin is red.
Solution:
- There are 8 sections, so each spin is red with probability 3/8 and blue with probability 5/8
- The spinner is unchanged between spins, so the second pair of branches repeats the first
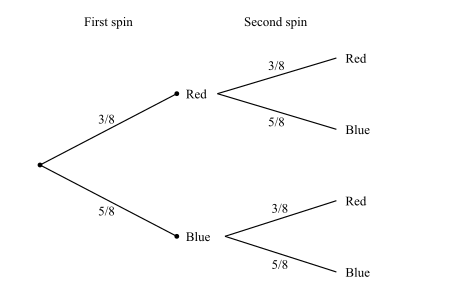
- Both red is a single route, so multiply along it: P(red, red) = 3/8 × 3/8 = 9/64
- Exactly one red happens two ways: red then blue, or blue then red
- P(red, blue) = 3/8 × 5/8 = 15/64, and P(blue, red) = 5/8 × 3/8 = 15/64
- Add the separate routes: 15/64 + 15/64 = 30/64 = 15/32
- Check: the four routes come to 9/64 + 15/64 + 15/64 + 25/64 = 1
6. Sample space diagrams
Laying out every outcome
- Where two experiments happen together, a table shows every combination in a grid
- The syllabus calls it a sample space diagram, and a question may print it as a table of the possible outcomes, sometimes partly filled in for you to complete
- Put one experiment along the top and the other down the side, then fill each cell with the combined result
- The number of cells is the total number of outcomes, and counting the cells that satisfy an event gives the numerator
- Complete the whole grid before counting, since a systematic table makes miscounting almost impossible