1. Conversion graphs
Reading a value off
- Two quantities that are linked by a fixed rule can be plotted as one straight line, and that line is a conversion graph: either quantity can be found from the other
- Typical pairs are kilometres and miles, litres and gallons, one currency and another, or a charge against the amount used
- To convert, start on the axis holding the value you have, go across or up to the line, then turn and read the other axis
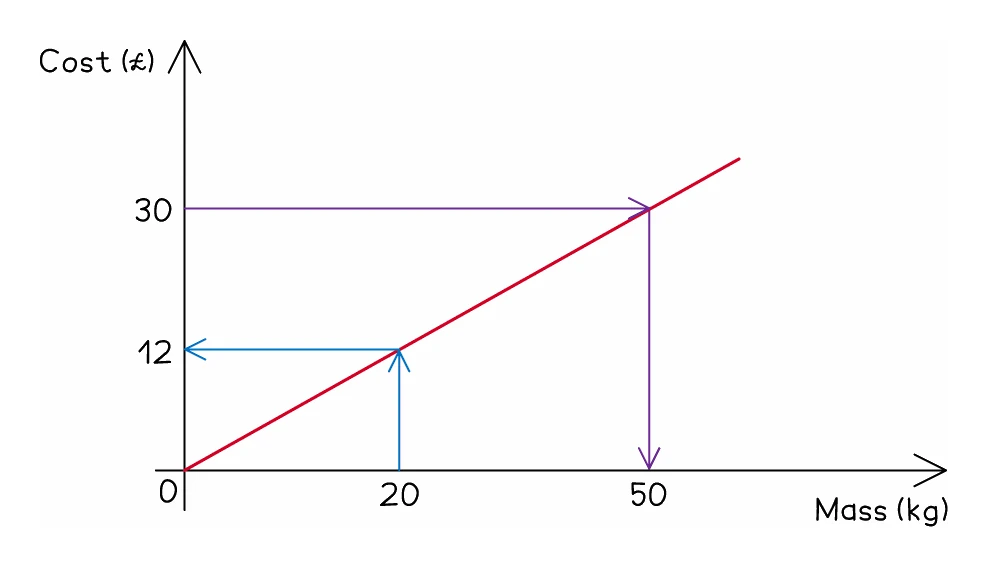
- Draw those two lines on the graph in pencil, because the examiner credits the reading and the working shows where it came from
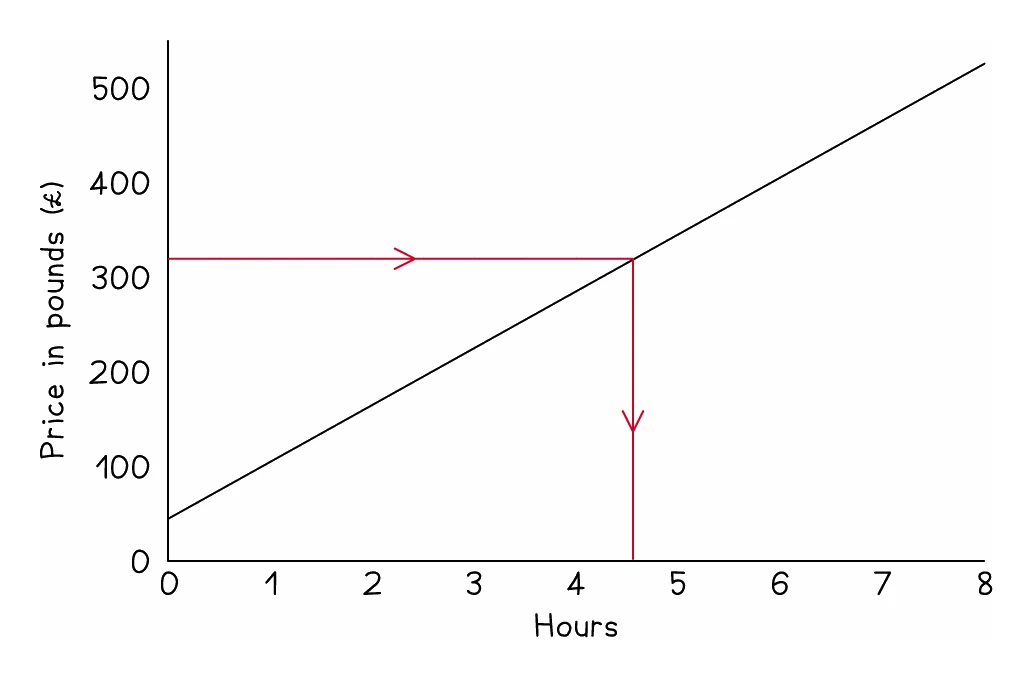
- Read the scale on each axis before anything else, since one square is very often not one unit
Graphs through the origin, and graphs that are not
- A line through the origin means the two quantities are in direct proportion, so values can be scaled up
- If 80 km reads as 50 miles, then 240 km is three times as far, giving 150 miles
- A line that starts part way up the vertical axis has a fixed amount built in, and scaling then fails
- A taxi charging £3 before it moves plus £2 for each mile starts at £3 and reaches £13 after 5 miles
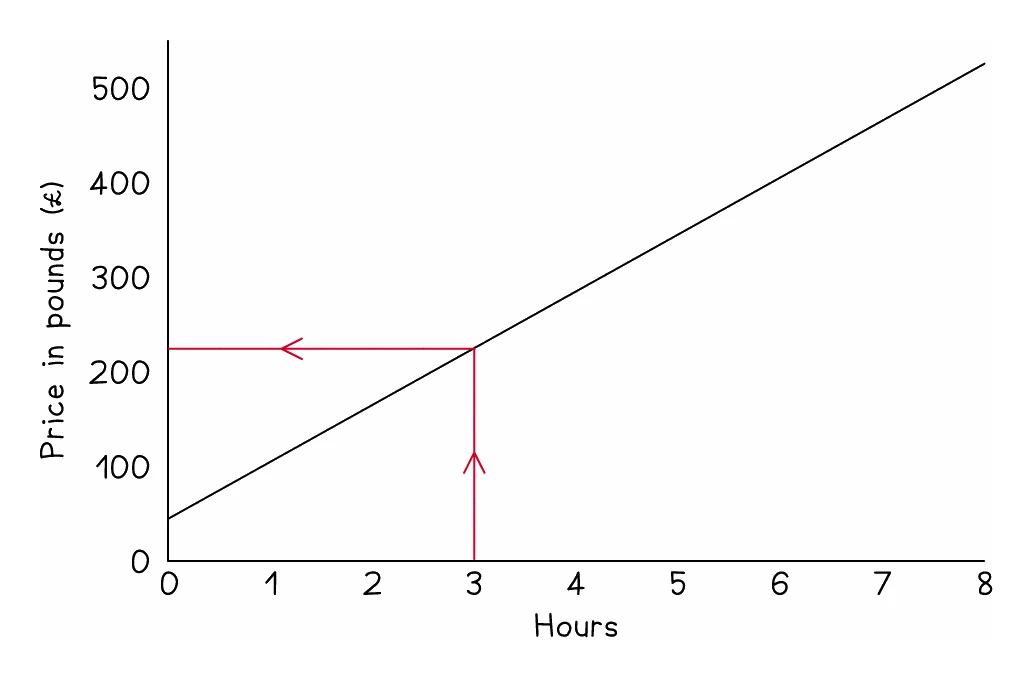
- That starting value is the fixed charge, read where the line meets the vertical axis
- To convert a value beyond the printed grid on such a graph, find the equation of the line instead of scaling
Worked example
Reading a conversion graph both ways
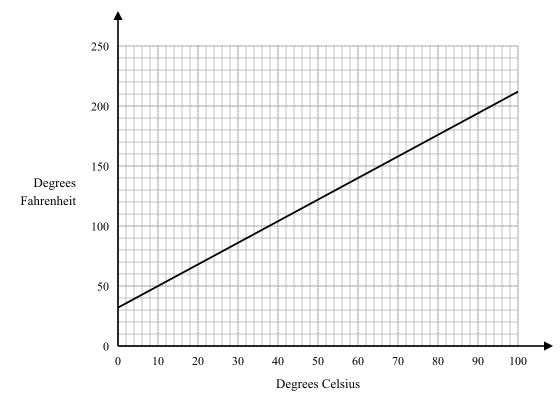
The graph converts between degrees Celsius and degrees Fahrenheit. Use it to convert 100 °F into °C, and 60 °C into °F.
Solution:
- For 100 °F, start on the vertical axis because Fahrenheit is the quantity given
- Go across from 100 until the line is reached, then straight down to the Celsius axis
- The reading is a little under 38, so 100 °F is about 37.5 °C
- For 60 °C, start on the horizontal axis this time
- Go up from 60 until the line is reached, then straight across to the Fahrenheit axis
- The reading is 140 °F
- The line does not pass through the origin: at 0 °C it is already at 32 °F, so these two scales cannot be converted by multiplying alone
2. Travel graphs
What the picture shows
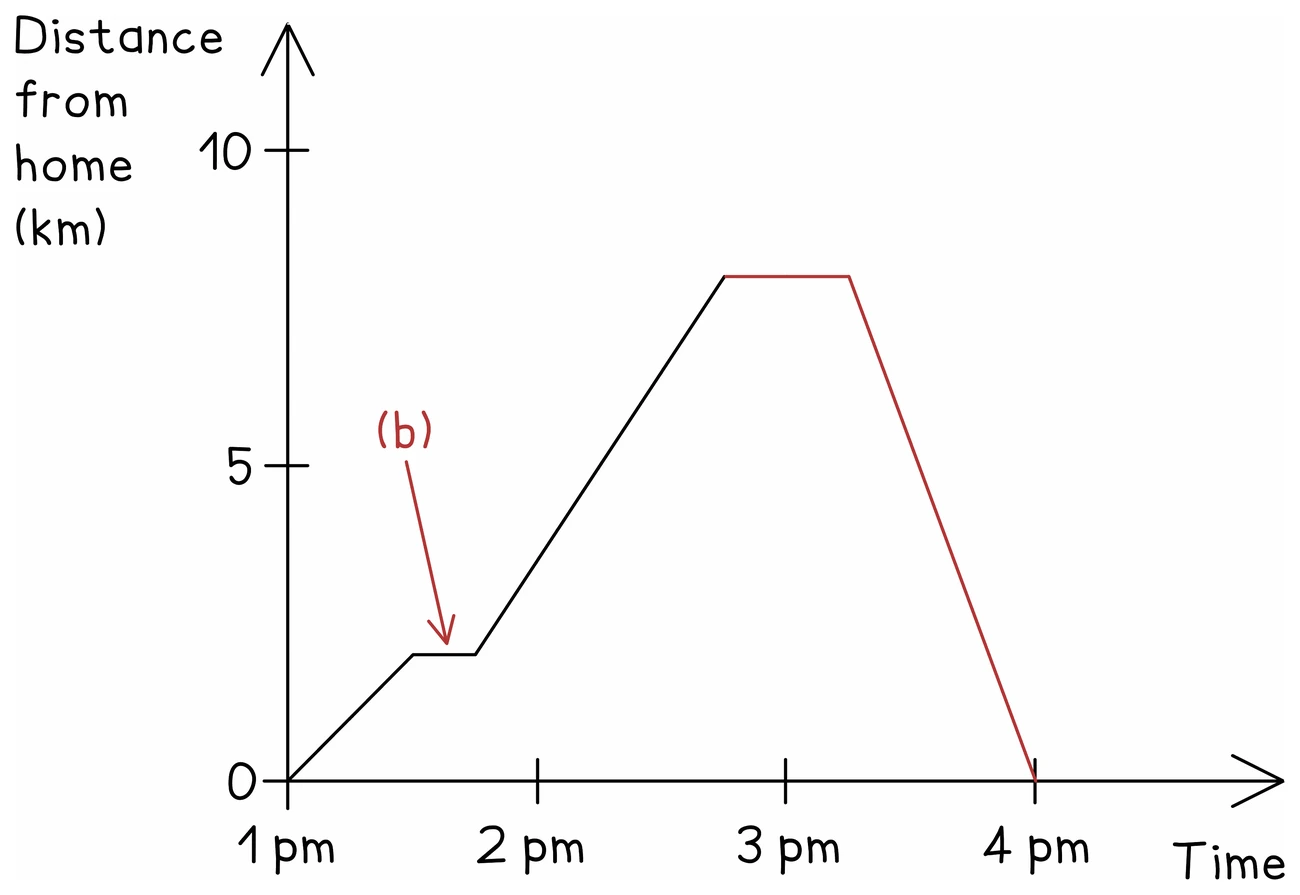
- A travel graph puts distance on the vertical axis and time on the horizontal one, so the line traces a journey
- The vertical axis usually reads "distance from" a named place, so it shows position rather than distance covered
- A sloping line means movement, and the steeper it is the faster the journey
- A line sloping up leads away from the starting place; one sloping down comes back towards it
- A horizontal line means the distance is not changing, so the traveller has stopped
- Times along the bottom are usually written in 24-hour clock form
Speed from the graph
- The gradient of a sloping section is the speed of that section
- Speed is the distance covered divided by the time taken, so read both from the grid and divide
- Take the units from the axes: kilometres against hours gives km/h, metres against seconds gives m/s
- Convert a time read in minutes to hours before dividing, or the speed comes out sixty times too small
- The average speed for a whole journey is the total distance divided by the total time, and the total time includes every stop
Worked example
A there-and-back journey
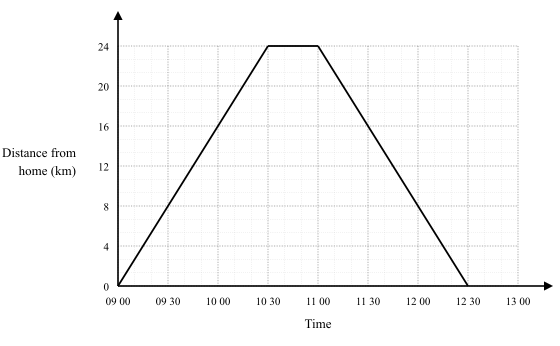
A cyclist leaves home at 09 00 and rides 24 km to a village, arriving at 10 30. She rests for 30 minutes, then returns home, arriving at 12 30. Find her speed on the outward ride and her average speed for the journey as a whole.
Solution:
- The outward ride runs from 09 00 to 10 30, which is 1.5 hours
- Speed out = 24 ÷ 1.5 = 16 km/h
- The rest lasts from 10 30 to 11 00, drawn as a horizontal line
- The return runs from 11 00 to 12 30, also 1.5 hours, so the return speed is also 16 km/h
- For the average speed, the total distance is 24 + 24 = 48 km
- The total time is 09 00 to 12 30, which is 3.5 hours, including the rest
- Average speed = 48 ÷ 3.5 = 13.714…, which is 13.7 km/h to 3 significant figures
- To add a journey to a printed travel graph, work out where it starts and where it ends, mark both points, and join them with a ruled line
3. Gradient as a rate of change
What the number means
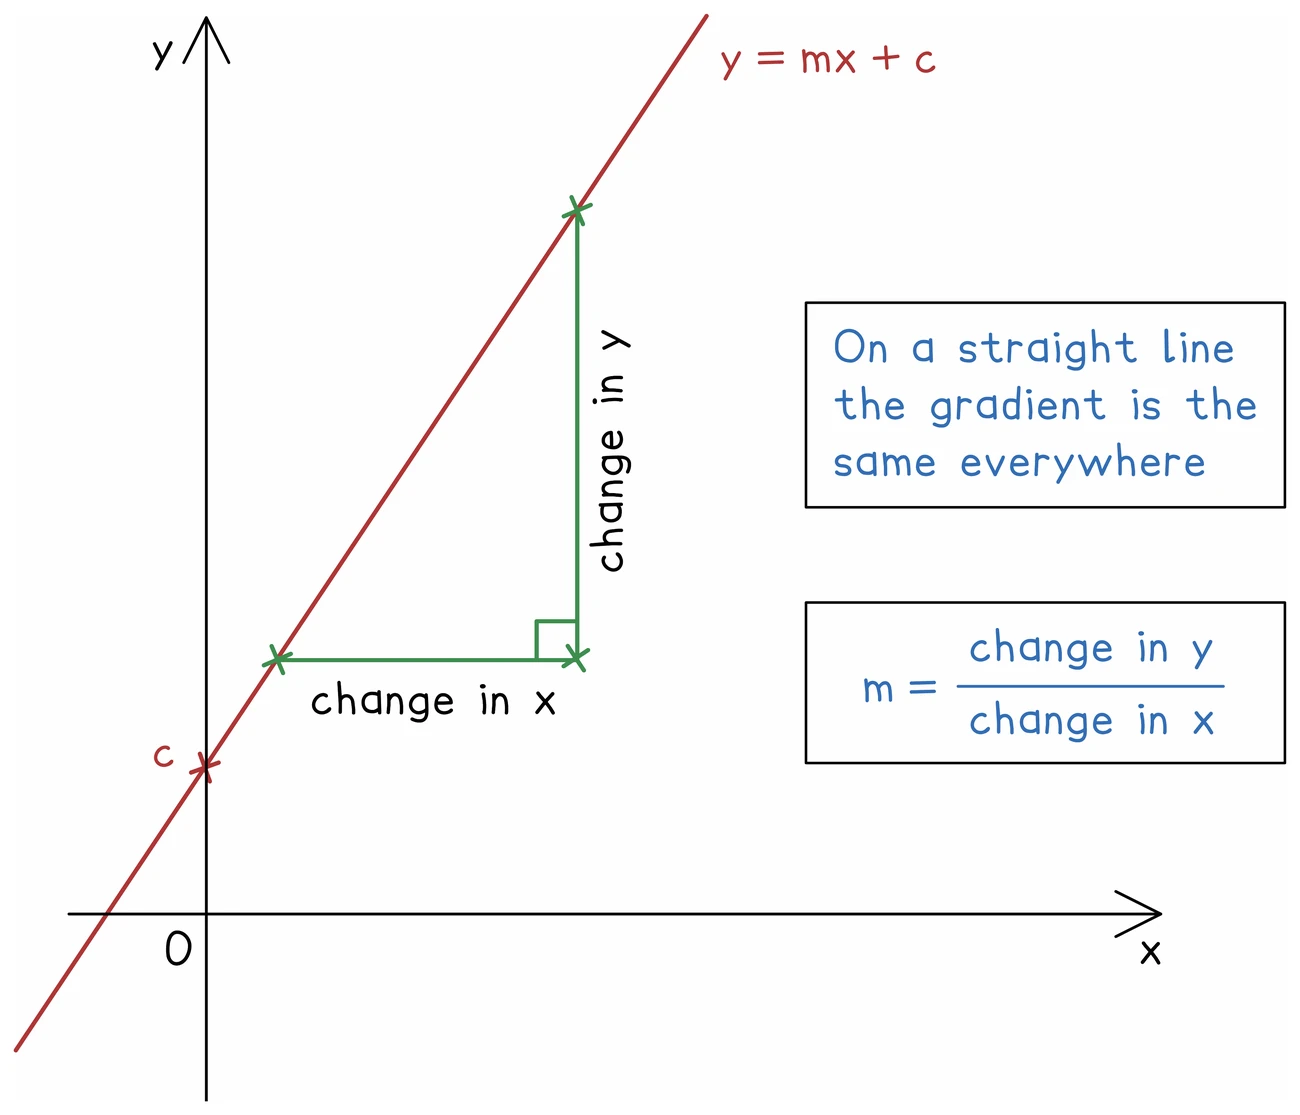
- On any graph of one quantity against another, the gradient says how much the vertical quantity changes for each unit of the horizontal one
- The units of that rate are the units up the side divided by the units along the bottom
- Litres against minutes gives litres per minute
- Dollars against hours gives dollars per hour
- A straight line means the rate never changes; a horizontal line means the quantity is not changing at all
- A negative gradient means the vertical quantity is falling as the horizontal one increases
- A graph of fuel in a tank against distance driven has a negative gradient, and its size is the fuel used per kilometre
- A question asking what the gradient represents wants the quantity named with its units, not just a number
Worked example
Saying what a gradient means
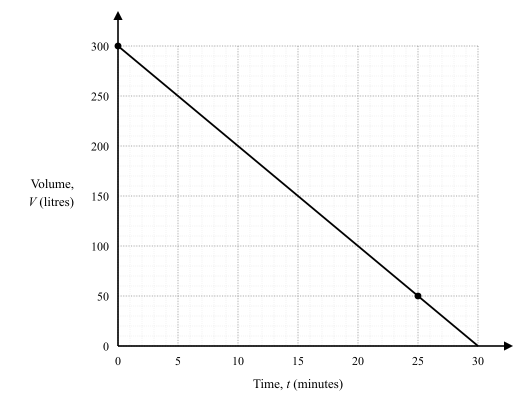
A tank is being emptied. The graph of the volume of water V litres against the time t minutes is a straight line through (0, 300) and (25, 50). Find the gradient and say what it represents.
Solution:
- Gradient = change up the side ÷ change along the bottom
- Change in volume = 50 − 300 = −250 litres
- Change in time = 25 − 0 = 25 minutes
- Gradient = −250 ÷ 25 = −10
- The units are litres per minute, taken from the two axes
- The gradient is negative because the volume is falling, so it represents the tank emptying at 10 litres per minute
- Naming the quantity and its units is what the question asks for; the bare number −10 is not an answer to "what does the gradient represent"