1. What supply is
Supply is the quantity of a good or service that producers are willing and able to offer for sale at a given price over a given time period.
The mirror of the demand definition. Two parts are essential.
- Willing. The producer is prepared to sell at the price on offer.
- Able. The producer has the resources to actually produce the good (capital, raw materials, labour). A firm without the inputs is not part of supply.
Like demand, supply is always measured over a time period (per day, per month, per year) and at a specific price or across a range of prices.
A definition that only gives an amount, such as "everything the firm has in stock" or "the amount in the warehouse", is incomplete and earns one mark at most. Supply is the quantity offered for sale at a price, not inventory.
Exam tip
Define supply with both willingness and ability
When you are asked to define supply (2 marks), give both halves: producers are willing to sell a good or service, and they are able to provide it because they have the resources to produce it. The scheme gives one mark to each half, so "firms are willing to sell" on its own stops at one mark. An answer that only describes an amount, such as the quantity a firm produces or what is available in the market, is treated as incomplete and also earns one mark at most.
2. The supply curve
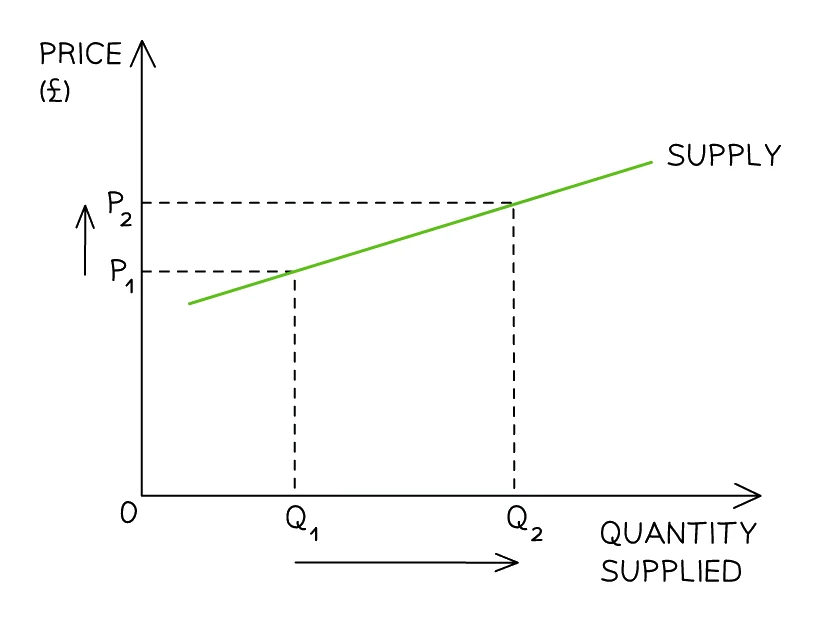
A plots the quantity of a good producers will offer (horizontal axis) against the price (vertical axis). It slopes upward from lower-left to upper-right, the opposite direction to the demand curve. Exam diagrams use straight lines for ease.
Standard layout on every supply-curve diagram:
- Vertical axis: price (in £ or $ per unit).
- Horizontal axis: quantity supplied per period (units per week, per month).
- Curve labels:
Sfor a single supply curve. When the curve shifts, label the originalS₁and the new curveS₂, whichever way it moves: the specimen mark scheme and most exam diagrams do this. (The figure in section 5 shows both possible shifts from one original curve, so it labels that curveS.)
3. The law of supply
The states that, holding all other factors constant (), as the price of a good rises, the quantity supplied rises; and as the price falls, the quantity supplied falls.
In one symbol: price and quantity supplied are directly (positively) related (P↑ → Qs↑, P↓ → Qs↓), ceteris paribus.
Two intuitions behind the law:
- Higher profit per unit. When the selling price rises, each unit produced earns more profit, so firms have a stronger incentive to make more.
- New firms enter. A higher price makes the market more attractive. Firms that previously could not cover their costs may now enter, raising total supply. A lower price drives some firms out, reducing supply.
Just like the law of demand, the law of supply requires ceteris paribus. If costs or technology change at the same time as price, the simple positive relationship may not show cleanly, so include "all else equal" whenever you state the law.
The law of supply explains the upward slope of the supply curve. The law of demand explains the downward slope of the demand curve. Remember which is which:
- Demand curve slopes down: P↑ → Qd↓ (an inverse relationship).
- Supply curve slopes up: P↑ → Qs↑ (a direct relationship).
Common exam question
What the upward slope of a supply curve shows
Question: Choose the statement that says what a supply curve shows, or how a higher price along it benefits the firms that supply the good (1 mark, multiple choice).
Set in 2 of the 13 multiple-choice papers. The keyed answers are the law of supply and the reason for it: price and quantity supplied are positively related, and a higher price gives firms the chance to earn more profit, so they are willing to offer more for sale.
Most wrong options either turn the relationship round (fewer goods supplied at a higher price, more profit at a lower price, fewer firms entering as the price rises) or explain the curve through buyers (consumers with more purchasing power, consumers buying more). A supply curve shows sellers' decisions at each price; what consumers want or can afford belongs to demand.
4. Movement along the supply curve
A change in the good's own price (and nothing else) produces a movement along the existing . The curve stays put; only the point on it moves.
Extension of . When the price rises (P↑), the quantity supplied rises, and the point moves up and to the right along the curve.
Contraction of supply. When the price falls (P↓), the quantity supplied falls, and the point moves down and to the left along the curve.
Note that the directions are the opposite of demand. With demand, extension is caused by a price fall; with supply, extension is caused by a price rise. The naming is consistent only in that "extension" always means a movement that produces a larger quantity and "contraction" always produces a smaller quantity.
Common exam question
Naming a movement along a supply curve and its cause
Question: Name a movement along a supply curve and its cause, or read the change in quantity supplied off a schedule (1 mark, multiple choice).
Set in 3 of the 13 multiple-choice papers. A rise in the good's own price moves the point up the curve, an extension of supply; a fall moves it down, a contraction. The curve stays put, so an option that pairs the change with a shift is wrong.
For the cause, find what changed the price. In the papers it is demand: an increase in demand, say from higher consumer incomes, raises the price and extends supply. Higher wages or lower productivity shift the supply curve, so they cannot cause a movement along it.
With a schedule, the change is the gap between the two quantities, not the new total: if the price rises from 35 and the quantity supplied goes from 450 to 520 units, supply extends by 70 units.
5. Shifts of the supply curve
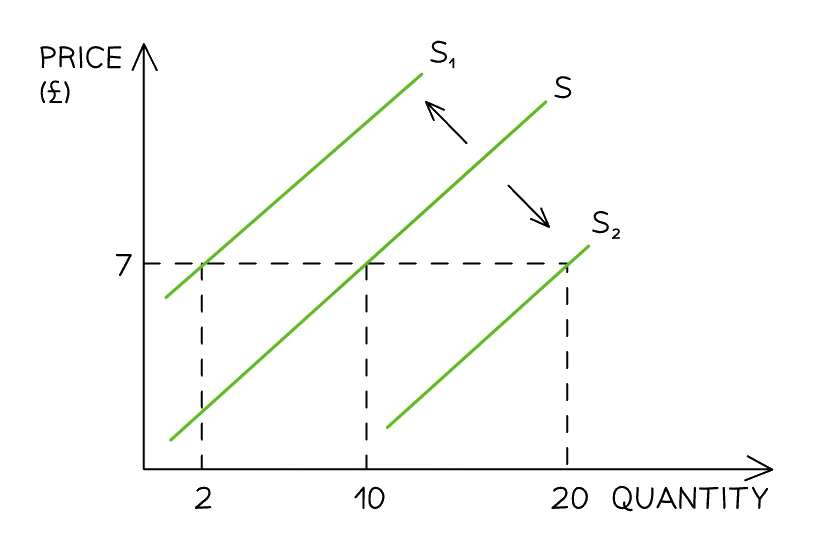
A change in any factor other than the good's own price moves the whole curve sideways. These non-price factors are collectively called the .
Increase in supply = a rightward shift of the curve (to S₂ in the figure above). At every price, producers now offer more.
Decrease in supply = a leftward shift of the curve (to S₁ in the figure above). At every price, producers now offer less.
A useful mnemonic: CONTEST
The mnemonic CONTEST covers seven non-price supply factors.
| Letter | Stands for | Effect on supply |
|---|---|---|
| C | Costs of production | Costs ↑ (higher wages, fuel, raw materials) → supply ↓ (curve shifts left). Costs ↓ → supply ↑. |
| O | Other goods' prices | If a related product becomes more profitable to make, firms switch to it, reducing supply of this good. |
| N | Number of producers | More firms entering the industry → market supply ↑. Firms exiting → market supply ↓. |
| T | Technology | New, better technology lowers unit costs and raises productivity → supply ↑. Ageing or broken technology → supply ↓. |
| E | Expectations of future prices | If producers expect prices to rise soon, they may hold stock back today, reducing current supply. The reverse if they expect prices to fall. |
| S | Subsidies | A government subsidy lowers each producer's effective cost → supply ↑. Removing a subsidy → supply ↓. |
| T | Taxes (indirect) | A tax on producers (VAT, excise duty) raises their cost of bringing the good to market → supply ↓. Cutting an indirect tax → supply ↑. |
Beyond CONTEST, another commonly examined non-price factor is weather events (especially for agricultural products): a drought or flood destroys crops and shifts supply left; unusually good growing conditions shift supply right.
The conditions of supply in detail
1. Costs of production. This is the single most-tested supply factor on the exam. Anything that raises a firm's costs reduces the profit it earns from each unit sold and so reduces supply at every price.
- A rise in wages (labour cost) shifts supply left.
- A rise in raw material prices (e.g. oil, steel, wheat) shifts supply left.
- A rise in energy costs shifts supply left.
- A rise in rent or interest on borrowing shifts supply left.
Falls in any of these costs shift supply right. Costs of production are sometimes called input costs.
2. Other goods' prices. A firm with flexible production can switch between making different products. If a related product becomes more profitable (its price rises), the firm shifts resources toward it and reduces supply of the original good. A farm that can grow either wheat or rapeseed will plant more rapeseed if the rapeseed price rises, reducing wheat supply.
3. Number of producers. More firms in the market = larger total market supply. Firms enter when profits look attractive (rising prices, falling costs); they exit when losses persist. The supply curve of the whole market depends on how many firms are operating.
4. Technology. New technology that raises productivity (output per worker, output per hour) shifts supply right. Examples: precision farming raising crop yields; automation raising factory throughput; AI tools speeding up software development. Technology shocks (a system failure, the loss of a critical supplier) can shift supply left.
5. Expectations of future prices. A producer who expects prices to rise next month may hold inventory back today (storing crops, restricting output) to sell at the higher future price; current supply falls. Expecting prices to fall has the opposite effect: producers offload stock now, raising current supply.
6. Subsidies. A subsidy is a payment from the government to producers that lowers their effective per-unit cost. Subsidies are common for products the government wants to encourage (solar panels, electric vehicles, public transport). A subsidy shifts the supply curve right: at every price, producers can profitably supply more.
7. Indirect taxes. An (VAT, excise duty on alcohol, fuel duty, sugar tax) raises the cost of each unit sold. It shifts the supply curve left: at every price, less is supplied.
Keep one distinction clear: a subsidy or tax aimed at consumers of a good does not shift supply; it changes demand. The clean answer is: subsidies and taxes on producers shift ; subsidies and taxes on consumers affect demand. A tax on a product is still drawn as a supply shift when consumers end up paying part or all of it.
Common exam question
Choosing the change that shifts a supply curve
Question: Pick the change that would shift a supply curve to the right, say what caused a shift on a diagram, or find the change that would not shift supply (1 mark, multiple choice).
Set in 3 of the 13 multiple-choice papers. The keyed causes change what each unit costs to make: a fall in costs of production or a rise in productivity shifts supply to the right. Costs, indirect taxes and subsidies all shift it; direct taxes were keyed as not shifting it, as they fall on incomes and profits, not on each unit sold.
Among the wrong options, a change in the good's own price is a movement along the curve, and a buyer-side change (fewer people wanting the product, a dearer substitute) shifts demand. Higher costs or a higher tax on the product shift supply left.
6. Shift vs movement: the central distinction
| Movement along the supply curve | Shift of the supply curve | |
|---|---|---|
| What changes? | The good's own price | Any non-price factor (costs, technology, taxes, subsidies, number of firms, expectations, other-good prices, weather) |
| What does the curve do? | Stays put | Moves to a new position |
| What do we call the change? | Extension (price ↑) or contraction (price ↓) | Increase in supply (rightward) or decrease in supply (leftward) |
| What changes on the diagram? | The point on the curve | The whole curve |
| Vocabulary | "change in quantity supplied" | "change in supply" |
Exam tip
Explain a supply shift through costs of production
When a scenario hits producers (a wage rise, a drought, a subsidy), explain the change in supply through the cost of production, not just its direction. Higher costs mean less is supplied at every price, so the curve shifts left and the price rises; a subsidy cuts costs, so supply increases and the price falls. One scheme makes the link compulsory: a higher price earns its mark only when it is tied to higher costs. Write each link of the chain (cost, supply, price) as its own step.
7. Individual supply and market supply
Individual supply is the quantity one firm is willing and able to offer at each price. Market supply is the sum of all individual supplies at each price.
To build the market supply curve, the supply from every firm is added horizontally (quantities at each price are added together).
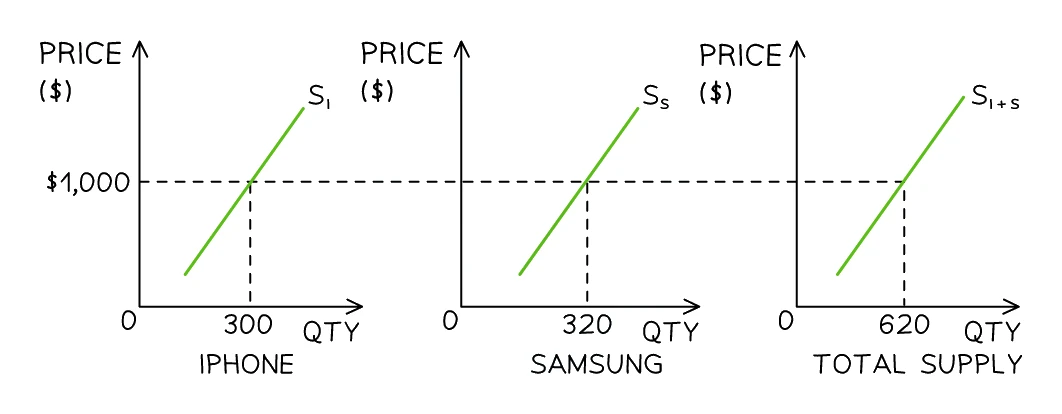
For example, at a price of $1,000 one producer offers 300 units and another offers 320 units; adding these quantities across gives a total market supply of 620 units at that price.