1. What a PPC is
A production possibility curve (PPC) is a graph showing the maximum combinations of two goods that an economy can produce when every resource is fully and efficiently employed at the current state of technology.
Two parts of the definition are essential.
- Maximum combinations. The curve shows the upper limit of what the economy can produce, not what it currently does produce.
- Full and efficient employment + current technology. The curve is drawn for a fixed set of resources and a fixed level of technology. Change either assumption and the curve shifts.
The PPC is the cleanest way to picture three of the syllabus's earliest concepts at once: scarcity, choice and opportunity cost.
2. The axes and the curve
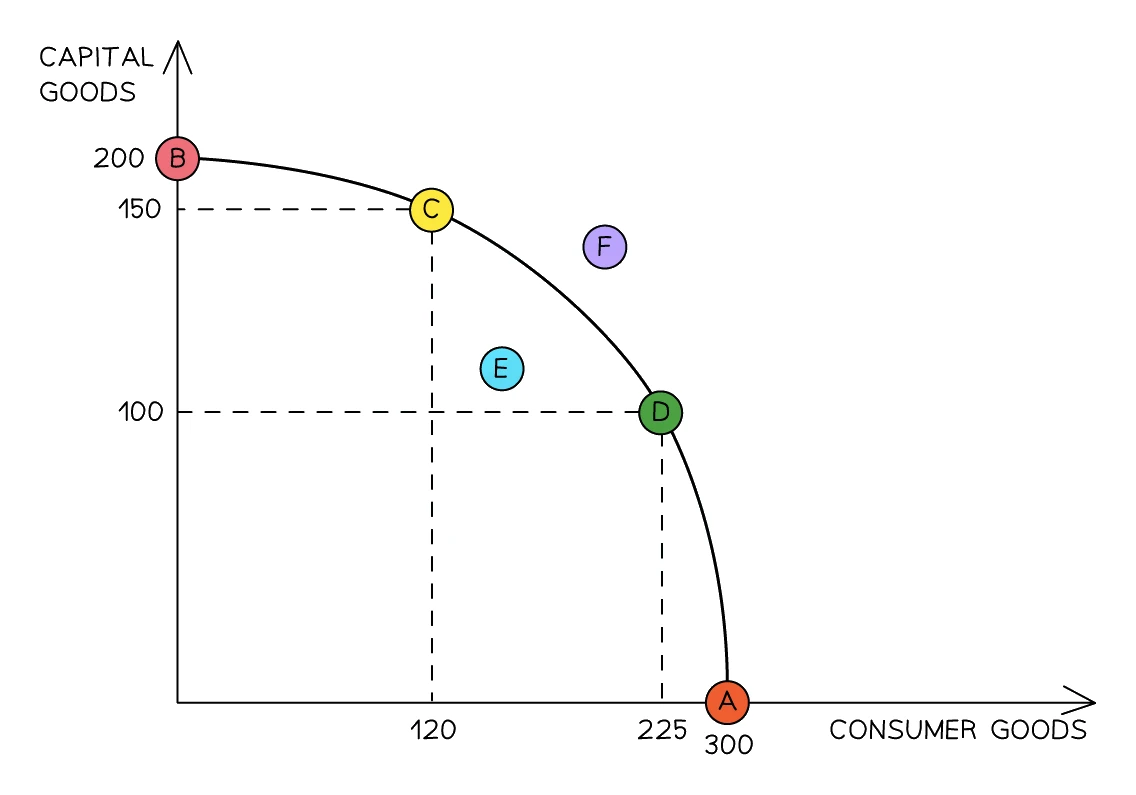
A PPC always has two axes. Each axis is the quantity of one good that the economy might produce. Common pairings:
- on one axis, on the other (the most common pairing).
- Food vs clothing; agricultural goods vs manufactured goods; healthcare vs education.
The curve typically bows outward away from the origin. It starts where all resources go to good A (one extreme), ends where all resources go to good B (the other extreme), and passes through every efficient mix in between.
A reminder of two terms the syllabus uses on this diagram.
- Capital goods are man-made productive assets used to make other goods (machines, tools, factories). An industrial 3D-printer on a parts manufacturing line is a capital good.
- Consumer goods are final products bought to be enjoyed or used up (a watch, a smartphone, a pair of shoes). They have no further productive use.
3. Reading any point on a PPC
On the curve, inside the curve, outside the curve. Every production point on a PPC diagram falls into one of these three cases.
Points on the curve
A point that sits exactly on the curve is productively efficient: every resource is fully employed and is producing as much as it can. There is no waste.
A country with no idle factories, no unemployed workers, and no land sitting fallow is operating somewhere on its PPC. Moving to a different point on the same curve means making a different mix of the two goods, but still at maximum output.
Points inside the curve
A point inside (below) the curve represents productive inefficiency: some resources are idle, unemployed, or underused.
Inside the curve, the economy is producing less than it could. The same resources could be used to make more of both goods at once. Typical causes:
- High unemployment (workers want jobs but cannot find them).
- Factories running below capacity.
- Land left uncultivated.
- A recession that has pulled output below potential.
A move from a point inside the curve to a point on the curve uses no extra resources; it simply uses the existing resources better. There is no opportunity cost for that move because nothing was given up.
Points outside the curve
A point outside (beyond) the curve is currently unattainable. Given the economy's current resources and technology, that combination of outputs is impossible.
To reach an outside point, the economy needs more resources or better technology; only then does the curve itself shift outward.
A point outside the curve is not "inefficient": it is impossible with the current PPC. Inefficiency lives inside the curve.
Common exam question
Significance of points inside, on and outside a PPC
Question: Explain what it means for a production point to be inside an economy's PPC and on it, or identify two places a production point can lie (2–4 marks).
Asked in 2 of the 11 structured papers. In the 4-mark version each point earns one mark for its significance and one for explaining it. Inside the curve, output is below what the economy could achieve, because some resources are unemployed or used inefficiently. On the curve, output is at its maximum, because all resources are employed efficiently.
For the 2-mark version any two of inside, on and outside score ("below" and "above" are accepted). A point outside is unattainable with current resources and technology, not inefficient.
The same idea is set in 2 of the 13 multiple-choice papers: a point on the curve is the most the economy can make with today's technology, and a move from inside to the curve gives more of both goods from idle resources.
4. Movement along the curve and opportunity cost
When an economy is already efficient (on its curve) and decides to produce more of good A, it cannot magically also produce more of good B. The resources used to make extra A have to come from B. That is the opportunity cost, made visible.
A movement along the PPC illustrates the opportunity cost of switching resources between two goods. Producing more of one good can only be done by producing less of the other.
Common exam question
Reading opportunity cost off a PPC diagram
Question: A PPC diagram shows a move along the curve; pick the opportunity cost, the good it is the cost of, or the point where one more unit costs most (1 mark, multiple choice).
Set in 3 of the 13 multiple-choice papers. The opportunity cost of making more of one good is the amount of the other good given up, so measure it on the other good's axis, from its old to its new output; a distance on the axis of the good being gained is set as a wrong option. Name the cost after the good gained: a move towards consumer goods shows the opportunity cost of more consumer goods. Options about social cost test a different idea.
On a bowed-out curve, one more unit of a good costs most where the economy already makes a lot of it, near that good's own axis. Extra output from a point inside the curve costs nothing, because idle resources produce it.
5. Calculating opportunity cost from a PPC table
Suppose an economy can produce wheat and cloth. Five combinations are possible, all on the curve.
| Combination | Wheat (units) | Cloth (units) |
|---|---|---|
| A | 0 | 120 |
| B | 30 | 110 |
| C | 60 | 80 |
| D | 90 | 40 |
| E | 110 | 0 |
Reading the table from A to E (taking on more wheat each time), the opportunity cost rises:
| Move | Extra wheat | Cloth given up | Per-unit OC |
|---|---|---|---|
| A → B | 30 | 10 | 0.33 cloth per unit of wheat |
| B → C | 30 | 30 | 1.00 cloth per unit of wheat |
| C → D | 30 | 40 | 1.33 cloth per unit of wheat |
| D → E | 20 | 40 | 2.00 cloth per unit of wheat |
The opportunity cost rises as the economy specialises further in wheat. That is why the PPC is usually drawn curved outward rather than as a straight line: as more resources are switched to wheat, the resources being moved are ones less and less suited to wheat production. This is sometimes called the .
6. Shifts of the PPC
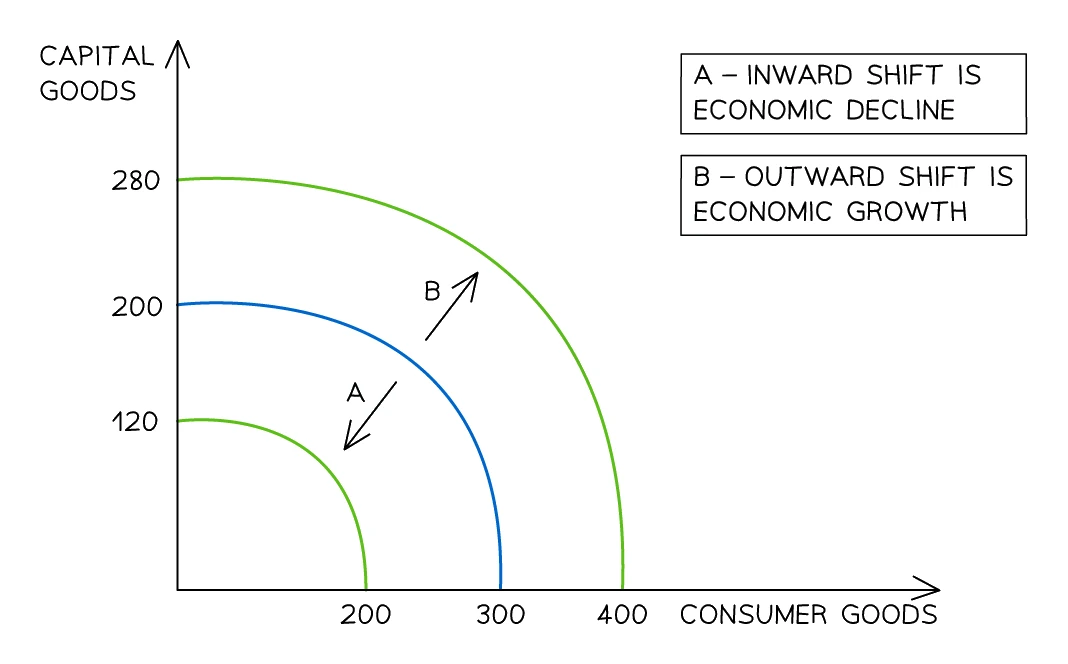
A movement along the PPC is one thing. A shift of the whole PPC is something different and is caused by changes in the underlying resources or technology.
An of the entire PPC means the economy can now produce more of both goods at once. This is the textbook definition of of productive potential.
An of the entire PPC means the economy can now produce less of both goods. This is economic decline of productive potential.
Causes of an outward shift (economic growth)
Anything that raises the quantity or quality of the factors of production, or improves the technology used to combine them.
| Cause | What changes |
|---|---|
| Net inward migration | Quantity of labour rises |
| Capital investment | More machinery, factories, infrastructure |
| Discovery of new natural resources | Quantity of land rises (new oil field, new mineral seam) |
| Improved education and training | Quality of labour rises (more skilled, more productive workers) |
| Better health of the workforce | Quality of labour rises (fewer days lost to illness) |
| New technology | Same resources produce more output per worker / per machine |
| Productivity-enhancing reforms | Better infrastructure, deregulation that frees up factor markets |
Causes of an inward shift (economic decline)
Anything that reduces the quantity or quality of factors.
| Cause | What changes |
|---|---|
| War | Capital destroyed; labour lost to combat or displacement |
| Natural disaster | Land or capital destroyed (earthquake, tsunami, flood) |
| Resource depletion | Land falls (oil fields run dry, fish stocks collapse) |
| Mass emigration / brain drain | Quantity and quality of labour falls |
| Pandemic | Labour quality and quantity fall short-term |
| Catastrophic policy failure | Capital and skilled labour fall (very high inflation, sanctions, civil collapse) |
A reliable real-world example for an outward shift: a country opens a major new copper deposit and begins extracting it. An example for an inward shift: a 2011 tsunami in Japan destroying coastal infrastructure and depressing the country's productive capacity for years.
Common exam question
Drawing a shift of the PPC
Question: Draw a PPC diagram, or analyse using one, to show how a change such as a shrinking labour force or climate change affects an economy (4–6 marks).
Asked in 3 of the 11 structured papers. The diagram earns up to four marks, one each for: both axes labelled, each with a different good; the original curve sloping down to meet both axes; the new curve, also drawn to both axes; and the shift marked by an arrow or by labelling the curves PPC1 and PPC2. A curve stopping short of the axes loses its mark. The new curve goes inside the old one when the change reduces the quantity or quality of resources, and outside it when they increase.
In the analyse version (5–6 marks) the diagram is capped at four marks and the rest need the written chain: the change alters the resources available, so the economy's productive capacity, the most it can produce, falls or rises.
Exam tip
Explain a PPC shift through a change in resources
When a question asks for two reasons a country's PPC shifted inwards, base each one on a fall in the quantity or the quality of resources, and develop it: one mark for the reason and one for explaining it. A shrinking labour force means fewer workers, so the economy can produce less; fewer students going on to university lowers the skills and productivity of labour. The same chain, reversed, explains an outward shift.
That question gives no marks for a PPC diagram, so put your time into the two explanations.
Two patterns that examiners specifically test
- Lower unemployment is NOT an . Reducing unemployment moves a point that was inside the curve closer to the curve. The curve itself does not move. Only changes in resources or technology shift the curve.
- A movement along the curve is NOT a shift. Changing the mix of two goods on an unchanged curve is a movement; only changes in the underlying resource base or technology shift the whole curve.
Common exam question
Telling a shift of the PPC from a move along it
Question: A PPC diagram shows the curve shifting outwards or the economy moving along it; choose what could have caused the change (1 mark, multiple choice).
Set in 4 of the 13 multiple-choice papers. Decide first which change the diagram shows. A move along the curve means resources were switched from one good to the other, so the answer is a choice about what to produce: more resources given to one good, or more consumer goods to raise living standards. An outward shift needs more or better resources, such as improved education raising the quality of labour.
The wrong options are causes of the other kinds of change. Falling unemployment appears in three of the four items, and it never moves the curve: it takes a point inside the curve towards it. Productivity gains or newly discovered resources, offered beside a move along the curve, would shift the curve instead.
7. The PPC and the three big questions
Topic 1 introduced the three fundamental economic questions: what to produce, how to produce it, for whom to produce it. The PPC shows the what question in pure form.
- A point on the curve represents one specific answer to "what to produce" (a particular mix of the two goods).
- Sliding along the curve corresponds to choosing a different answer, which always carries an opportunity cost.
- A whole new curve (after a shift) corresponds to a changed range of feasible "what to produce" answers.
The PPC does not directly answer the "how" or "for whom" questions; those involve choices about production methods and income distribution, neither of which is shown on the two axes.