1. What PES measures
Price elasticity of supply (PES) is the responsiveness of the quantity supplied to a change in the price of the good.
PES is the mirror of PED on the producer side. The law of supply (topic 5) says that when price rises, the quantity supplied rises. PES asks: by how much? A factory with spare machinery and a warehouse of stock can ramp up output overnight; a coffee farmer cannot bring in a fresh harvest until next season. PES puts a single number on that responsiveness.
Build the definition on the word responsiveness and say what responds: the quantity supplied, not just "supply". "How supply changes when price changes" is too loose to define PES.
Exam tip
Define elastic supply with percentage changes
When you are asked to define elastic supply (2 marks), compare the two percentage changes: quantity supplied changes by a larger percentage than price. That one sentence earns both marks. Writing only that supply changes by more than price, or only that PES is greater than 1, earns one mark, so give the percentage comparison and add PES > 1 after it if you like. Inelastic supply is the same sentence the other way round: quantity supplied changes by a smaller percentage than price, so PES is less than 1.
2. The PES formula
PES is the percentage change in quantity supplied divided by the percentage change in price. Both numbers are percentages, not raw unit changes. The percentage-change formula is the same as for PED:
PES is positive: the supply curve slopes upward, so a price rise produces a rise in quantity supplied. Both percentage changes have the same sign, so the ratio is positive. There is no sign-convention trap here, unlike PED.
3. The five categories of PES
Just like PED, supply can be sorted into five categories. All five are named in the syllabus and can be tested, so learn the value of PES for each.
| Category | Value of PES | What it means | Typical example |
|---|---|---|---|
| Perfectly inelastic | 0 | Qs is fixed; no responsiveness at all | A single Picasso painting; seats at a sold-out concert venue |
| Relatively inelastic | 0 < PES < 1 | %ΔQs is smaller than %ΔP | Most agricultural goods, oil in the short run |
| Unitary (unit) elastic | PES = 1 | %ΔQs equals %ΔP | Any straight-line supply curve drawn through the origin |
| Relatively elastic | PES > 1 | %ΔQs is larger than %ΔP | Manufactured goods with spare factory capacity |
| Perfectly elastic | ∞ | Producers will supply any amount at the given price; supply is unlimited | A buffer stock released at a fixed guaranteed price, while the stock lasts |
The quickest check on any PES value: less than 1 = inelastic; greater than 1 = elastic. But know the three exact values too: 0 = perfectly inelastic, 1 = unit elastic, infinity = perfectly elastic.
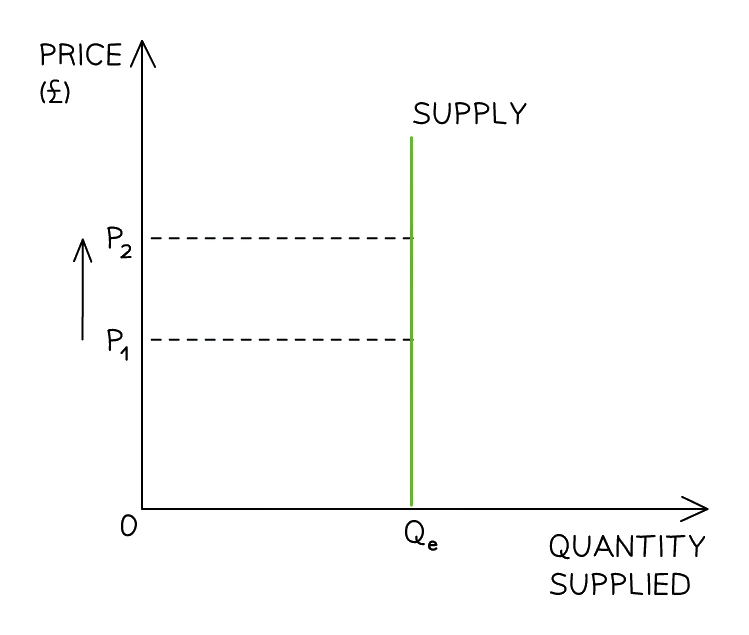
Each category corresponds to a distinctive supply-curve shape. A perfectly inelastic supply curve is vertical: quantity supplied stays fixed at Qe however far price rises, from P1 to P2.
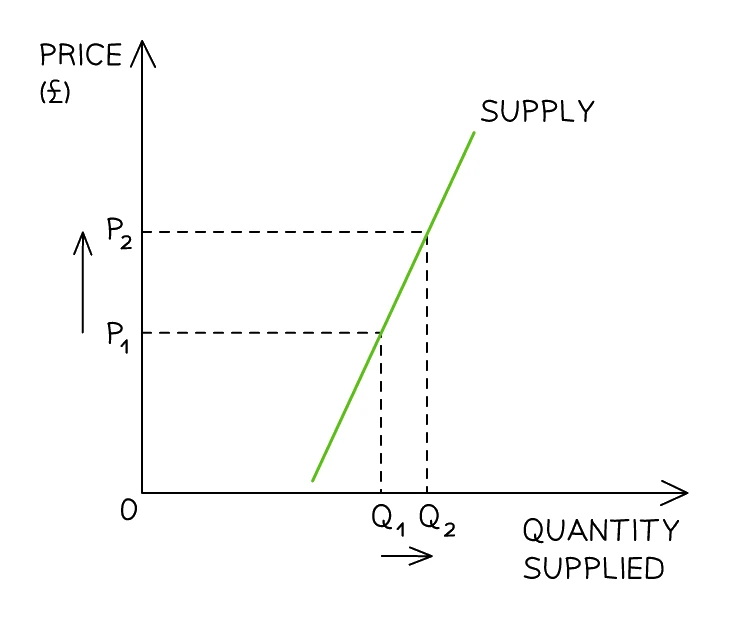
A relatively inelastic supply curve is steep: a rise in price from P1 to P2 produces a smaller proportional rise in quantity supplied from Q1 to Q2.
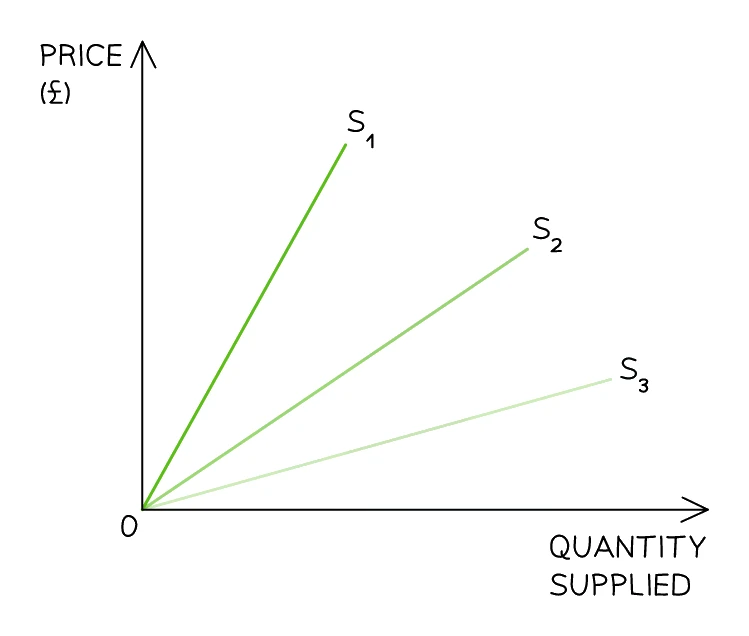
A unit elastic supply curve is any straight line drawn through the origin: whatever its slope, the percentage change in quantity supplied always equals the percentage change in price, so PES = 1 along the whole curve.
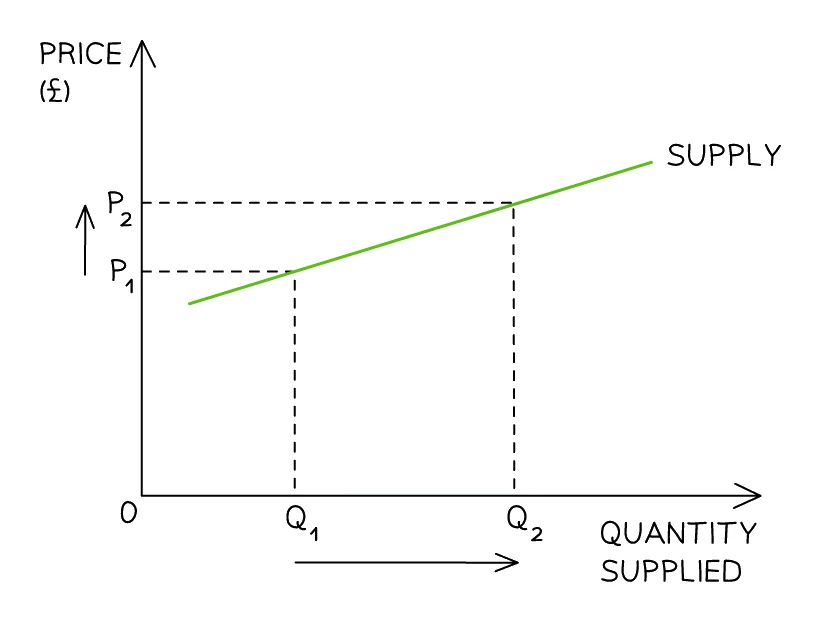
A relatively elastic supply curve is shallow: the same rise in price from P1 to P2 produces a larger proportional rise in quantity supplied from Q1 to Q2.
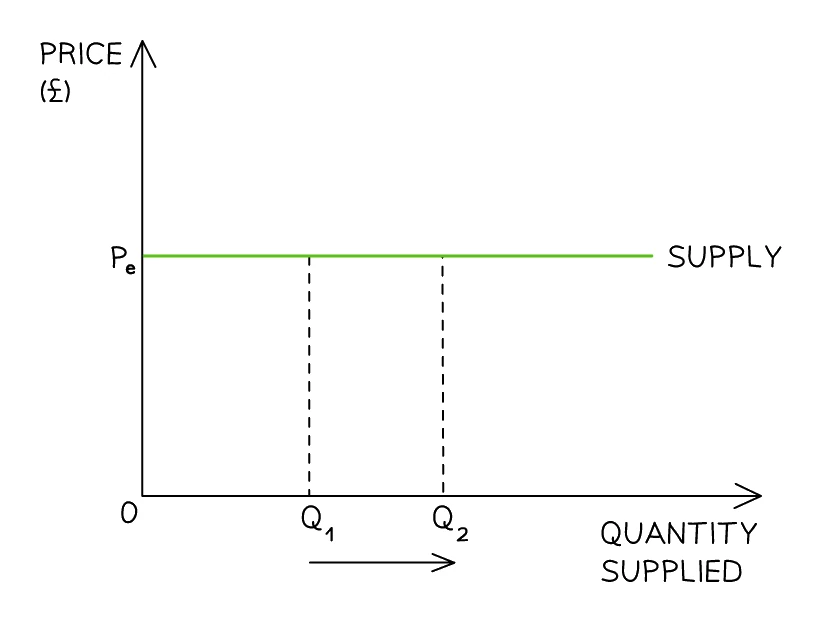
A perfectly elastic supply curve is horizontal: producers will supply any quantity at price Pe, from Q1 to Q2, but nothing at all below it.
Common exam question
Picking out perfectly inelastic supply on a diagram
Question: A diagram shows four straight lines crossing at one point; choose the line that shows perfectly inelastic supply (1 mark, multiple choice).
Set in 2 of the 13 multiple-choice papers, and both times the answer is the vertical line: quantity supplied stays the same however far the price moves, so PES = 0. The other three lines are the traps. The horizontal line is the opposite extreme, perfectly elastic supply. The upward-sloping line is an ordinary supply curve (in one paper it starts at the origin, which makes it unit elastic). The downward-sloping line has the shape of a demand curve, so it does not show supply at all.
The 2027 syllabus names perfectly inelastic, unitary elastic and perfectly elastic supply explicitly, so be ready to pick out the horizontal line or a line from the origin in the same way.
4. Calculating PES step by step
Every PES calculation follows the same three steps; when the question also asks what the value means, add a one-line interpretation.
Step 1. Calculate the percentage change in quantity supplied.
Step 2. Calculate the percentage change in price.
Step 3. Divide: PES = %ΔQs ÷ %ΔP.
Step 4. Interpret the result: say whether supply is elastic (
PES > 1) or inelastic (PES < 1).
Worked example
Calculate and interpret price elasticity of supply
A bakery currently produces 600 loaves per week at a price of $2.00 per loaf. When the price rises to $2.50, the bakery increases output to 720 loaves per week. Calculate the price elasticity of supply and state whether supply is elastic or inelastic.
Solution:
- % change in quantity supplied = (720 − 600) ÷ 600 × 100 = +20%
- % change in price = (2.50 − 2.00) ÷ 2.00 × 100 = +25%
- PES = 20% ÷ 25% = 0.8
- Because PES < 1, supply is price-inelastic: quantity supplied rises by a smaller percentage than price.
Common exam question
Calculating PES in a multiple-choice item
Question: Calculate PES from a change in price and quantity supplied, pick out the PES formula, or use a given PES to find the change in quantity supplied (1 mark, multiple choice).
Set in 4 of the 13 multiple-choice papers. Divide the percentage change in quantity supplied by the percentage change in price. Wrong options include that ratio upside down, a ratio of raw unit changes and a negative value, though PES is positive. If price rises from $4 to $5 (25%) and quantity supplied from 200 to 230 (15%), PES = 15 ÷ 25 = 0.6, not 1.67.
If price and quantity both double, PES is exactly 1, even though the unit changes differ. To work backwards, % change in quantity supplied = PES × % change in price; then convert that percentage to units with the original quantity. With PES 0.5, a 20% price rise adds 10% to quantity supplied: 30 units on 300, not 10.
5. The determinants of PES: STAMP
Five non-price factors determine whether the supply of a good is elastic or inelastic. The mnemonic STAMP holds them.
| Letter | Stands for | Effect on PES |
|---|---|---|
| S | Spare capacity | More spare capacity (idle machines, underused workers) → supply more elastic (firms can ramp up output quickly). No spare capacity → supply inelastic. |
| T | Time period | Short run: factors of production are fixed → supply inelastic. Long run: firms can build new factories, hire more workers, plant more crops → supply more elastic. |
| A | Ability to store the product | Storable / non-perishable goods → supply more elastic (firms can release stock when prices rise). Perishable goods → supply inelastic. |
| M | Mobility of factors of production | The easier it is to switch labour and capital from making one product to making another, the more elastic supply is. Factories that can switch between products (e.g. car plants from petrol to electric) have higher PES. |
| P | Production inputs (raw-material availability) | Abundant raw materials → supply more elastic. Scarce or geographically restricted raw materials → supply inelastic. |
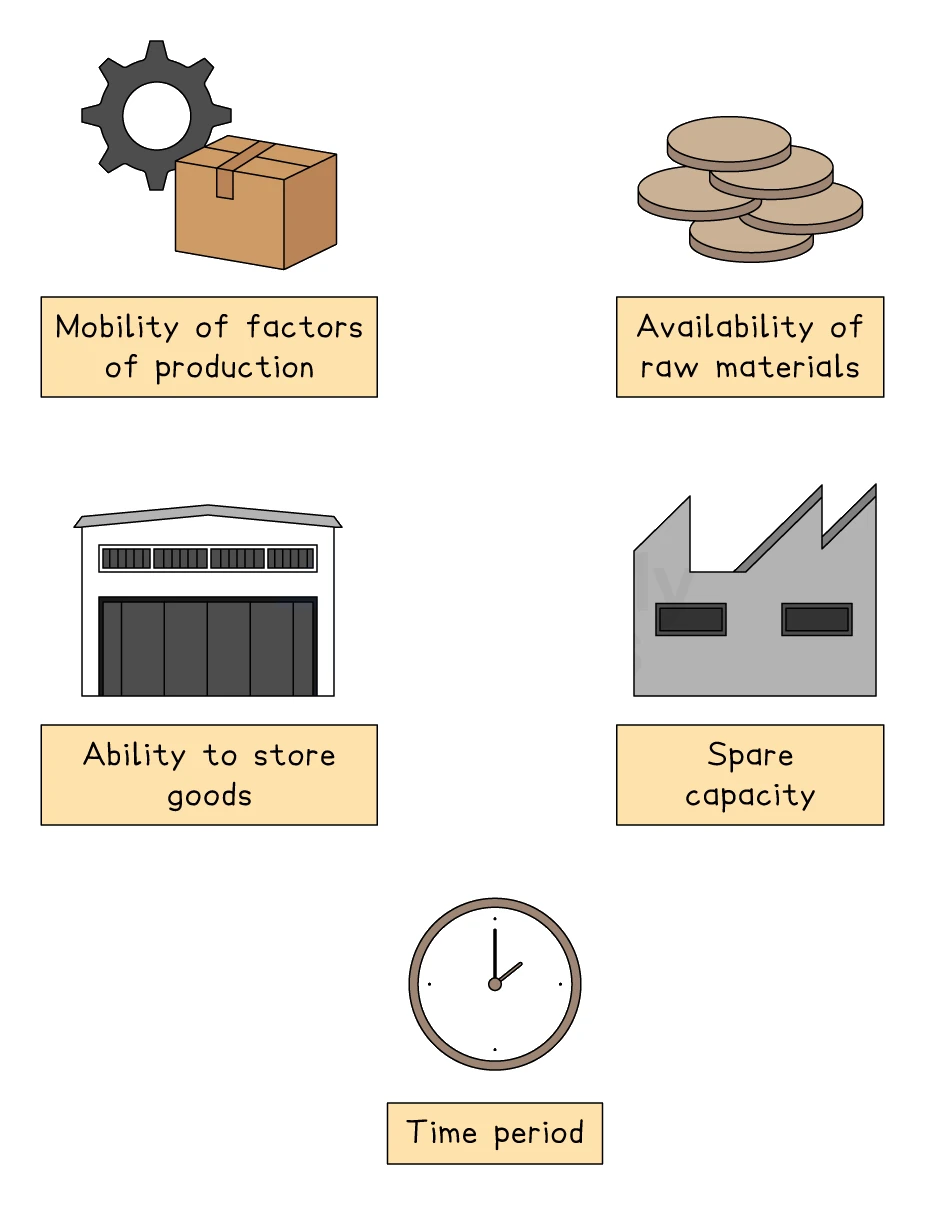
The five determinants in detail
1. Spare capacity. If a factory's machinery is only running at 60% of maximum, and there are idle workers willing to take extra shifts, the firm can increase output very quickly when prices rise. PES is high. A factory already running flat out at 100% capacity cannot increase output until new machinery is installed; PES is low.
2. Time period. Time is the single most important determinant for many real-world goods.
- Very short run (a few days/weeks): most factors are fixed. Supply is close to perfectly inelastic. A coffee farmer cannot grow more coffee in a week.
- Short run (a few months): firms can hire more workers, work overtime, source slightly more raw materials. Supply becomes a little more responsive.
- Long run (years): firms can build new factories, plant new crops, train new workers. Supply is much more elastic.
The same good can have very different PES at different time horizons. This is why oil supply is inelastic in the short run (existing wells produce at fixed rates) but more elastic in the long run (new wells can be drilled).
3. Stock / ability to store. Goods that can be stored have higher PES: firms can build inventory in low-price periods and release it when prices rise. Tinned food, electronics and clothing are easy to store. Fresh fish, cut flowers and live concert tickets cannot be stored at all, so their PES is very low.
4. Factor mobility. If a firm's resources can be redirected easily from making other products into making this one, supply is more elastic. A clothing factory can quickly switch from making T-shirts to making dresses; PES for both is relatively high. A car-engine plant cannot quickly switch to making solar panels; PES is lower.
5. Raw-material availability. If the inputs needed to make the good are abundant and cheap, firms can scale up quickly when prices rise. If raw materials are scarce, geographically restricted, or only available from specific suppliers, PES is low. Lithium for electric-vehicle batteries is a good example: even with strong price signals, supply cannot expand as fast as demand because mining and refining take years.
Common exam question
Explaining the determinants of PES
Question: Explain two influences on the PES of a named product, or analyse its main determinants (4–6 marks).
Asked in 2 of the 11 structured papers. In the 4-mark version, name each influence (one mark) and explain it (one mark), ending with a direction: "… so supply is inelastic". The 6-mark version credits each link: the determinant, what it means and its effect on PES. The schemes credit stocks of unsold goods, storage costs, spare capacity, the time period (inelastic in the short run with a fixed factor, more elastic in the long run) and how long the good takes to make. Use an extract's clues, such as costly storage or slow-to-build capacity.
The same idea is set in 2 of the 13 multiple-choice papers. PES rises with longer storage life, not higher input costs (a supply shift) or more substitutes (a PED influence); and no policy makes supply elastic at once when production takes a long time.
6. PES and the shape of the supply curve
The shape of the supply curve on a diagram tells you, at a glance, roughly what PES looks like.
| Shape of supply curve | PES |
|---|---|
| Vertical line | Perfectly inelastic (PES = 0) |
| Steep (close to vertical) | Inelastic (PES < 1) |
| Straight line through the origin (any slope) | Unit elastic (PES = 1) |
| Shallow (close to horizontal) | Elastic (PES > 1) |
| Horizontal line | Perfectly elastic (PES = ∞) |
Common exam question
How PES changes the effect of a shift in demand
Question: Demand for a product shifts; choose the PES value that gives the largest change in price, or the largest change in quantity (1 mark, multiple choice).
Set in 2 of the 13 multiple-choice papers. Picture the demand curve shifting along a steep supply curve, then a flat one. With inelastic (steep) supply, output can hardly change, so the adjustment falls mainly on price; at PES = 0 price takes all of it. With elastic (flat) supply, more of it falls on quantity. So the lowest PES gives the biggest price change and the highest PES the biggest quantity change.
The two papers ask opposite things (the largest price rise after demand increases, the largest fall in quantity after demand decreases), so their answers sit at opposite ends of the list. Check which variable the question names.
A useful trick for these diagrams: any straight-line supply curve that passes through the origin is unit elastic (PES = 1) along its entire length, regardless of its slope. This is a quirk of the geometry that examiners occasionally test in multiple-choice questions.