1. Why population matters in economics
Population is the source of labour and the destination of demand. How many people a country has, and how those people are split between children, working-age adults, and the elderly, drives the size of the workforce, the level of consumer spending, the burden on public services, and the demands on the natural environment.
This topic looks at:
- how population is measured (birth, death, migration and dependency rates),
- why these rates differ between countries,
- the consequences of a rising or a falling population,
- the consequences of an ageing population and of changes in the gender balance,
- and how government policy can influence birth rates and migration.
2. Measuring population
Birth rate and death rate
The birth rate is the number of live births per 1,000 people per year.
The death rate is the number of deaths per 1,000 people per year.
Natural population change
Natural population change = births − deaths.
A positive natural change means the population is growing from within; a negative natural change means more people are dying than being born.
Net migration
Immigration is the movement of people into a country to live there. Emigration is the movement of people out of a country to live elsewhere.
Net migration = immigration − emigration over a period. A positive figure is a net inflow; a negative figure is a net outflow.
Net migration adds to or subtracts from the population independently of natural change. Some countries grow despite low natural change because of strong net inward migration (e.g. Canada, Australia in recent years). Others shrink despite positive natural change because emigration outpaces it.
Total population change
Total population change = (births − deaths) + .
Common exam question
What makes a population grow, shrink or age
Question: Choose what makes a population grow or age, or what a table of birth, death and migration figures shows (1 mark, multiple choice).
Set in 8 of the 13 multiple-choice papers. A higher birth rate, a lower death rate or net immigration speeds growth; a higher death or infant mortality rate, or net emigration, slows it. A later retirement age enlarges the labour force, not the population. A falling death rate both enlarges and ages a population; falling birth and death rates together must age it.
In a table, check the units: birth and death rates are per thousand people, but net migration may be a headcount. The natural rate of increase is the birth rate minus the death rate. To judge whether a population is falling, convert first: 10 million people with rates of 12 and 10 gain 20,000 a year, so net emigration of 30,000 shrinks it although births exceed deaths.
Why these rates vary between countries
All three rates differ sharply between countries, and questions ask you to explain why.
Birth rates are highest where children are cheap to raise and economically useful, and lowest where they are expensive and where women have other opportunities. The main influences are:
- Female education and workforce participation. Women who stay in education longer and hold paid jobs tend to have fewer children, and to have them later.
- Access to contraception and family planning, and how far it is socially and religiously accepted.
- Infant mortality. Where many children die young, families choose to have more, so a falling infant mortality rate eventually pulls the birth rate down.
- The cost of raising children. Schooling, housing and childcare are expensive in richer, urbanised economies. In poorer rural economies children add to family labour and support parents in old age, especially where there is no state pension.
- Culture, religion and social norms about family size and the age of marriage.
- Government policy, from family-planning programmes that lower the birth rate to child benefits and paid parental leave intended to raise it (section 6).
depend mainly on health, living conditions and the age of the population:
- Quality and availability of healthcare: doctors, hospitals, vaccination programmes, medicines.
- Nutrition, and access to clean water and sanitation.
- Income and living standards, which pay for better housing, diet and safety at work.
- Age structure: a country with a large elderly share has a higher death rate even if it is healthier, because more of its people are near the end of life.
- Conflict, natural disasters and pollution, which raise deaths well above the underlying trend.
Exam tip
Death rates differ for reasons that change the rate
To identify why death rates vary between countries (2 marks), give two separate differences that change deaths per thousand people: income and living standards, healthcare, nutrition, education, lifestyles, the average age of the population, infectious disease, war, natural disasters, air or water pollution, working conditions or crime. A larger population is not a reason, and the mark scheme refuses it: it raises the number of deaths, not the rate. Average age is why a rich country with good healthcare can still have a higher death rate than a poorer one: more of its people are old.
depends on the balance of push and pull factors, and on what governments allow:
- Wage and job differences. People move towards higher wages and better employment prospects.
- Political stability. Conflict, persecution and insecurity push people out; safety pulls them in.
- Immigration rules and visa systems, including points-based schemes for skilled workers and refugee programmes.
- Family, community and language ties, which make some destinations far easier to settle in than others.
- Environmental pressure, such as drought, flooding or crop failure driving people away from affected regions.
Common exam question
Why people migrate
Question: Analyse why workers may want to move to another area or country, or identify influences on which country someone works in (2–6 marks).
Asked in 3 of the 11 structured papers. Sort the reasons into pull factors at the destination and push factors at home. Pull: higher wages and more jobs, better working conditions and job security, better healthcare and education, cheaper housing, a lower cost of living or lower taxes, and family already there. Push: war, persecution or crime, poverty, natural disasters, pollution, and climate change that leaves land unfit to farm. The 2-mark Identify also credits language, the qualifications a job needs and immigration restrictions.
In a 6-mark Analyse, naming reasons earns at most 3 marks, so develop each into a chain: higher wages let a family buy more, raising its standard of living. Moving between regions of one country counts too: the scheme for moving to another area accepts it.
The typical pattern is that low-income countries have high birth rates with death rates that are falling quickly, so their populations grow fast and are young. High-income countries have low birth and death rates, so their populations grow slowly, or shrink, and are ageing. Migration usually runs from lower-wage to higher-wage countries, which reinforces both patterns: it adds working-age people to the richer country and removes them from the poorer one.
Exam tip
Linking two population figures from a table
Asked to analyse, say, how birth rate relates to average age (4 marks), state the expected direction: a low birth rate goes with a high average age, an inverse relationship. Support it by comparing countries; one country's figures copied out earn nothing. Explain the link (fewer births make children a smaller share), then show a country breaking the pattern against another, and say why: average age also depends on the death rate and net migration. The 2027 specimen pairs life expectancy with net migration and credits explaining the exception by other influences on migration, such as immigration controls.
Dependency ratio
The dependency ratio is the ratio of the non-working-age population (children plus elderly) to the working-age population, usually expressed as a percentage.
The working-age range is usually defined as 15–64. Dependants are everyone outside that range: under-15s and over-65s.
3. Effects of a rising or falling population
A growing population has both benefits and costs. A typical "discuss" question rewards a balance of both.
Benefits of a rising population
- Larger workforce. More working-age adults can produce more output. Potential GDP rises.
- Larger domestic market. Firms have more customers and can spread fixed costs over more units (economies of scale).
- More innovation. A larger talent pool produces more entrepreneurs, scientists and skilled workers.
- Higher tax base. More workers means more income tax and VAT revenue to fund public services.
- Counters ageing. Growth through the immigration of working-age people reduces the dependency ratio.
Costs of a rising population
- Pressure on housing. Faster population growth than housing supply pushes up rents and prices.
- Pressure on public services. Schools, hospitals, GP surgeries, transport must expand to keep up.
- Pressure on resources. Water, energy, raw materials are all consumed faster.
- Environmental damage. More pollution, more emissions, more congestion, faster depletion of natural resources.
- Strain on infrastructure. Roads, rail, broadband all need extra capacity.
- Possible falling output per head. If population grows faster than GDP, GDP per capita falls even though total GDP rises.
The optimum population
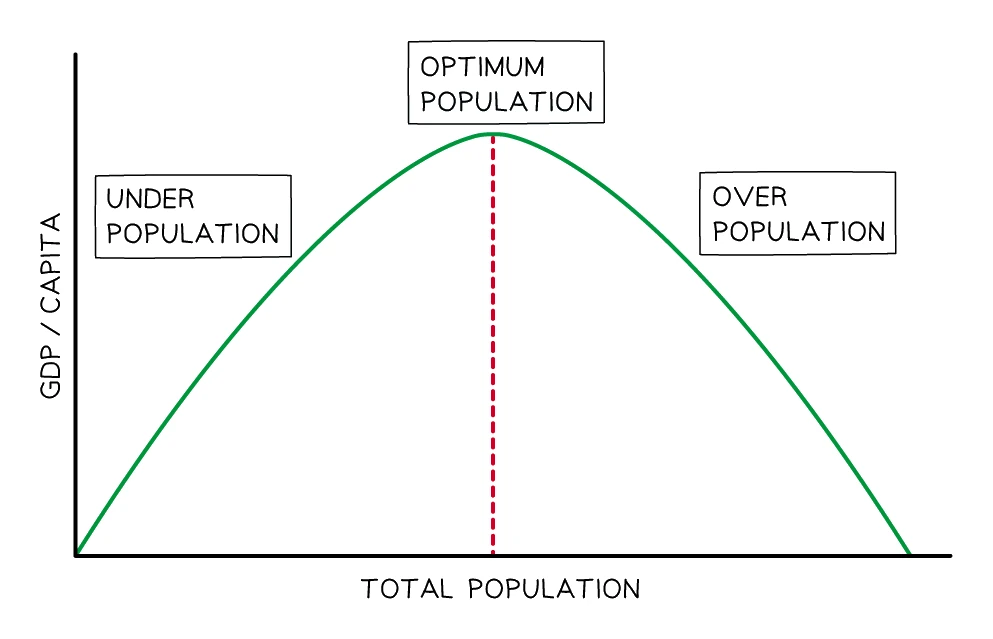
The optimum population is the size of population that, with the country's existing resources and technology, produces the highest output per head.
If a country is below its optimum, adding people raises output per head, because there are resources (land, capital) standing idle that the extra workers can use. If a country is above its optimum, adding more people lowers output per head, because the existing resources have to be shared among more workers. The optimum is not fixed: a rise in the capital stock, better technology or the discovery of new resources all raise the optimum population, so a number that was "too many" in one decade can be productively employed in the next.
Effects of a falling population
A population falls either through natural decrease (deaths exceeding births) or through net emigration. The cause matters: emigration-led decline removes working-age and often skilled people first, so its effects arrive quickly, while a low birth rate takes a generation to shrink the workforce.
Costs:
- Shrinking labour force. Fewer workers means lower potential output and slower long-run growth.
- Smaller domestic market. Fewer consumers means weaker aggregate demand, and firms lose economies of scale as output falls, so unit costs rise.
- Falling demand for housing and land. Prices and rents fall, which helps buyers but cuts the wealth of existing owners.
- Smaller tax base. Fixed public costs and any national debt are spread over fewer taxpayers, so the burden per head rises.
- Regional decline. Where the fall is concentrated, schools, shops and transport services close because too few people use them, which encourages further emigration.
Benefits:
- Less pressure on housing, public services and infrastructure, so existing capacity goes further per person.
- Less strain on the environment: lower congestion, less pollution and slower depletion of natural resources.
- Possible rise in output per head. This depends on the optimum population: a country above its optimum moves back towards the peak, so GDP per capita rises, while a country already below its optimum moves further away and GDP per capita falls.
Whether population growth is "good" or "bad"
The right answer depends on whether investment and productivity keep pace with the rising population, and on whether the country is below or above its optimum.
- If a country adds 1% to its population each year and invests enough to keep the capital stock, housing, infrastructure and public services growing at the same rate, the rising population is broadly positive. Output per head can hold steady or rise.
- If the population grows faster than investment, output per head falls: the new workers do not have the tools, capital or infrastructure they need to be productive.
This is the Malthusian concern: that population growth tends to outpace the resources needed to support it, dragging down living standards. The modern view is more nuanced: with enough investment in technology, education and capital, population growth need not impoverish a country, but it does require active policy.
Common exam question
Whether a larger or smaller population helps
Question: Discuss whether a country gains from a larger or fast-growing population, explain how firms gain, or identify benefits of a smaller population (2–8 marks).
Asked in 4 of the 11 structured papers. For: a bigger labour force raises output and tax revenue; more consumers raise total demand; firms gain a bigger market, economies of scale and easier recruitment. Immigrants may bring new skills. Below the optimum population, extra people use resources better.
Against: congestion, pollution, pressure on housing and welfare spending, inflation, and extra people who cannot find work; above the optimum, resources run down faster. It turns on where the extra people come from: working-age immigrants can lower the dependency ratio, while more births or longer lives add dependants and raise it. The 6-mark version allows up to 4 marks a side; the 8-mark one needs both sides developed.
A smaller population reverses these: fewer dependants, less pressure on resources and pollution, lower government spending.
4. Effects of an ageing population
An has a rising share of older people relative to working-age adults. It is not necessarily a shrinking total population; just one with a different age structure.
Causes of ageing:
- Falling (especially in developed countries).
- Rising life expectancy thanks to healthcare, nutrition and lifestyle improvements.
- The "bulge" of mid-20th-century baby-boomers passing into retirement.
Consequences
Questions ask how ageing changes spending and saving, or which consequence is most likely, such as more spending on healthcare and pensions.
1. Rising .
Fewer workers supporting more retirees. Each worker has to pay more in tax to fund pensions and social care. The tax burden on the working-age population rises.
2. Higher government spending on pensions and healthcare.
Older people draw state pensions for many years. They also use the health service much more heavily than younger people. Both push government spending up, often forcing tax rises or borrowing.
3. Shrinking labour force.
A smaller working-age population means fewer workers to produce goods and services. Potential output and long-run growth fall unless the gap is filled by immigration, retirement-age rises, or productivity gains.
4. Shifts in the pattern of demand.
The mix of goods and services consumers buy changes. Demand rises for healthcare, retirement services, care homes, adapted housing and age-focused leisure (cruises, gardening, healthcare-related products). Demand for goods aimed at younger people (school books, baby products, certain entertainment) falls. Firms in growing sectors benefit; firms in shrinking sectors struggle.
5. Pressure on pension systems.
Most state pensions are pay-as-you-go: current workers' taxes pay current retirees' pensions. With fewer workers per retiree, the system becomes financially unsustainable unless contributions rise, benefits fall, or retirement ages rise.
An ageing population is not all bad: firms in healthcare and age-related goods see rising demand, and older workers bring experience that can raise productivity. The challenge is to manage the transition without bankrupting the state.
Common exam question
Consequences of an ageing or a young population
Question: Explain how an ageing population affects spending and saving, or analyse two consequences of a large share of children under 16 (4–6 marks).
Asked in 2 of the 11 structured papers. On spending and saving, an answer covering only one of them is capped at 3 of the 4 marks. Retired people earn no wage and draw on savings, so saving falls; with no need to save for later, they may spend more; people nearing retirement save more and spend less now.
A young population needs heavy spending on schools, at the cost of healthcare. Few earners support many dependants: a high dependency ratio, less tax revenue, income spread thinly and lower output. The gain comes later, as they reach working age.
Set in 2 of the 13 multiple-choice papers: a growing share over 65 raises transfer payments such as pensions, and healthcare spending. Wrong options: a falling dependency ratio, more total saving, faster growth.
Changes in the gender distribution
The balance between men and women in the population also has economic effects. A country where a large share of working-age women are outside paid work has a smaller effective labour force than its headcount suggests, so policies that raise female participation (childcare provision, equal-pay enforcement) can expand output without any rise in population. A pronounced imbalance between the sexes, whether from migration patterns that draw mostly male workers or from social preferences that skew the birth ratio, changes the pattern of demand (for housing, services and certain goods) and, over a generation, can slow the birth rate and shrink the future workforce.
5. The demographic transition (background context)
The demographic transition is not named in the syllabus, so you will not be asked about its stages, but it is a useful way of seeing how the reasons in section 2 fit together. As a country develops, its falls first (better healthcare, nutrition, clean water and sanitation) while the birth rate stays high, so the population grows quickly and is very young. Later the falls too (female education and paid work, contraception, lower infant mortality, the rising cost of children, urbanisation), so growth slows and the population ages.
This is why most low-income countries today have fast-growing, youthful populations, while most high-income countries have slow-growing, ageing ones, and a few, such as Japan, South Korea and Italy, now have birth rates low enough for the total population to shrink.
6. How government policy affects birth rates and migration
One reason birth rates and net migration differ so much between countries is that governments deliberately try to influence them. A country worried that its birth rate has fallen too low uses very different measures from one whose population is growing faster than its resources, and immigration rules decide how easily people can move in at all.
Pro-natal policies: encourage births
Pro-natal policies aim to raise the birth rate in countries where it has fallen too low.
Common tools:
- Family allowances and child benefits paid to parents.
- Generous parental leave (maternity, paternity, shared).
- Free or subsidised childcare.
- Tax breaks for families with children.
- Pro-family advertising and information campaigns.
Examples: France, Sweden, Japan, South Korea have all run pro-natal programmes (with mixed success).
Anti-natal policies: limit births
Anti-natal policies aim to lower the birth rate in countries with rapid population growth straining resources.
Common tools:
- Family planning education and free contraception access.
- Tax penalties or reduced state benefits for additional children.
- Compulsory limits on family size (rare and controversial).
Examples: China's former one-child policy (1980–2015) is the most famous. India and Bangladesh have run extensive family-planning programmes. Most countries today rely on education and family planning rather than coercion.
Immigration policy
Used to add to or limit population growth via international flows.
- Pro-immigration policy. Open visa rules, points-based skilled-worker systems, refugee programmes. Used by countries with ageing populations (Canada, Australia, Germany) to grow the workforce.
- Anti-immigration policy. Tight visa rules, deportation policy, restrictive border controls. Used when domestic political pressure favours lower migration or when housing/public-service capacity is strained.
Common exam question
Whether migration benefits an economy
Question: Discuss whether employing migrant workers, or migration within a country, benefits an economy, or analyse the gains when some of a country's people work abroad (6–8 marks).
Asked in 3 of the 11 structured papers. Migrant workers raise the supply of labour, cutting wage costs and adding to productive capacity; they may be skilled, take jobs local people do not want, and their spending creates jobs. Against: they may take local jobs or accept lower pay, pulling wages down, and housing and infrastructure may not stretch to them. Moving within a country can shift workers to more productive areas, but the areas they leave can decline and destinations grow congested.
For the country people leave, tie every point to its people working abroad, as general benefits of emigration score nothing. Money sent home raises living standards and brings in foreign currency as secondary income; returning workers bring skills and ideas or start firms; unemployment at home may fall.
Immigration policy is usually the fastest influence on a country's population: changing visa rules can shift inflows within a year, where a change in the birth rate takes a generation to reach the workforce. This is why two countries with almost identical birth and death rates can still have very different rates of population growth.