1. How prices are set in a market
A market is any arrangement in which buyers can trade with sellers. The trade can be face-to-face (a street stall) or virtual (eBay, Amazon). In every market, the interaction of demand and supply sets the price at which goods change hands and the quantity that gets traded.
Topics 4 and 5 looked at demand and supply on their own. This topic puts them together.
Two opposing pressures meet in any market:
- Buyers want the price to be low (and bid less when it is high).
- Sellers want the price to be high (and offer more when it is high).
The two sides settle on the price at which the quantity each side wants to trade is equal. That price is the equilibrium.
2. Market equilibrium
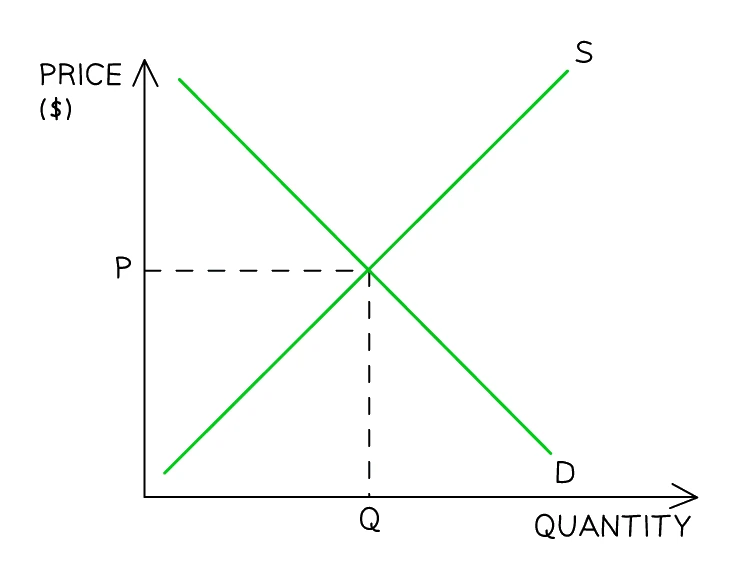
The market equilibrium is the price at which the quantity demanded by consumers equals the quantity supplied by producers (Qd = Qs). It is also called the market-clearing price, because at this price every unit produced is bought and no buyer goes away empty-handed.
On a diagram, the equilibrium is the single point where the demand curve and supply curve cross. The price at that intersection is the (often labelled Pe); the quantity is the (Qe).
Why "market-clearing"? At the equilibrium price, sellers manage to sell every unit they produce (the market clears their stock) and buyers manage to buy every unit they want. No frustrated seller is left with unsold goods; no frustrated buyer is left wanting more.
Equilibrium is a stable state. If the market is at equilibrium and nothing else changes, there is no pressure on the price to move. It moves only when one of the conditions of demand or supply changes.
Common exam question
Recognising equilibrium and disequilibrium
Question: Choose the statement that describes a market in equilibrium, or the one that must be true when a market is in disequilibrium (1 mark, multiple choice).
Set in 3 of the 13 multiple-choice papers. At equilibrium quantity demanded equals quantity supplied, so the keyed feature is that the market clears, with neither a surplus nor a shortage. Disequilibrium is any price at which the two differ, so what must be true is that there is excess demand or excess supply. A maximum price set below equilibrium, creating excess demand, is keyed as one example.
The wrong options swap the two states. The curves crossing, or quantity demanded matching quantity supplied, describes equilibrium, not disequilibrium; a surplus, or demand exceeding supply, is not a feature of equilibrium. Also wrong: that equilibrium means no profit is made, that a government must step in before anything sells, or that demand and supply can no longer change.
3. Disequilibrium: surplus and shortage
Whenever the actual price sits above or below the , the market is in . Two distinct cases.
Surplus (excess supply)
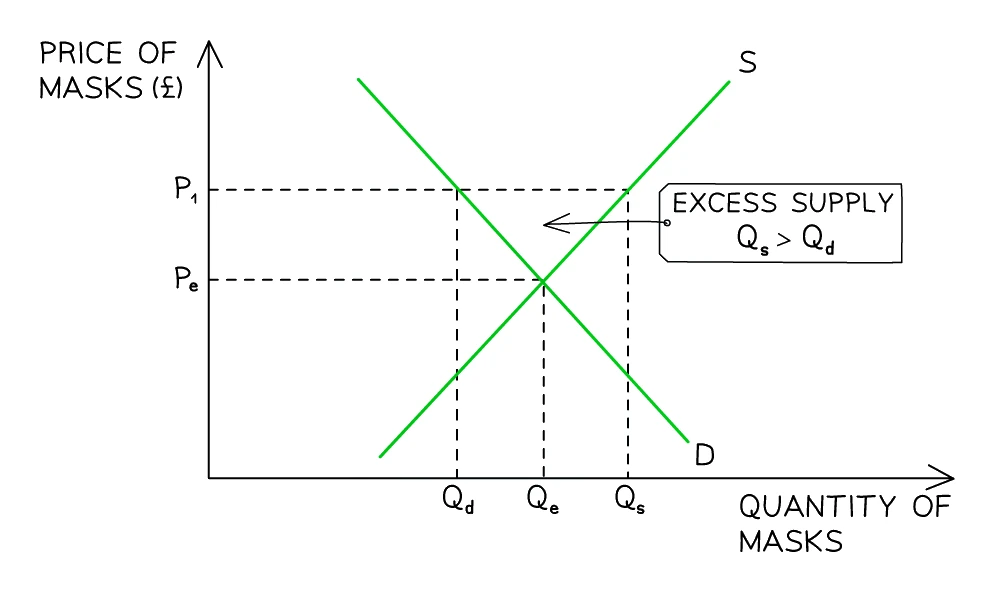
A (or excess supply) exists whenever the actual price sits above the equilibrium price. At that high price, quantity supplied exceeds quantity demanded (Qs > Qd). Sellers cannot shift all the stock they produce.
What happens next:
- Stock builds up in warehouses and on shelves.
- Sellers, frustrated by unsold stock, lower the price to attract more buyers.
- As the price falls, quantity demanded extends (a movement down the demand curve) and quantity supplied contracts (a movement down the supply curve).
- The two adjustments shrink the gap. The market returns to equilibrium at the lower price.
Shortage (excess demand)
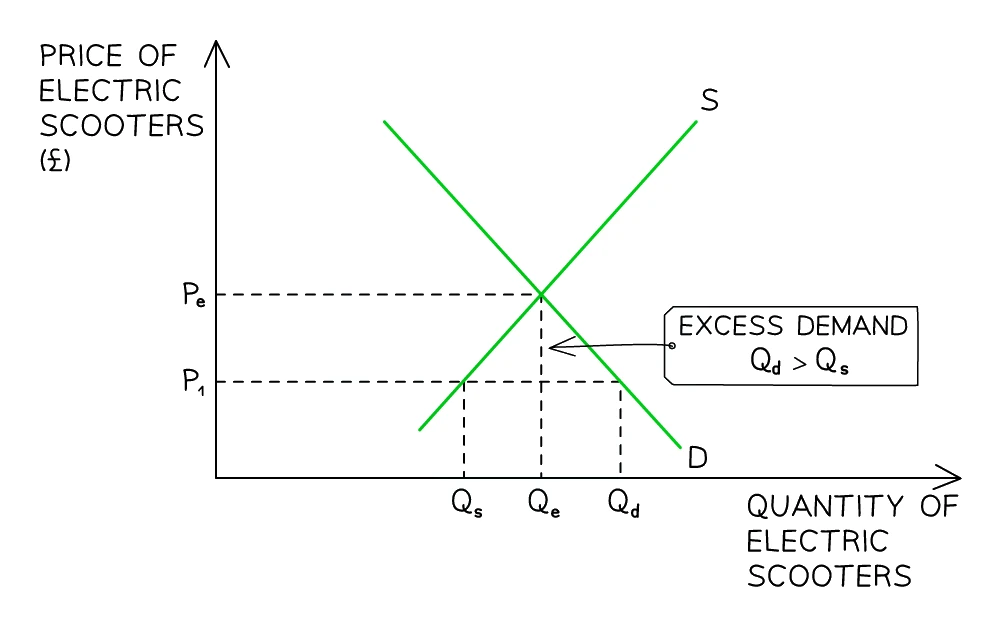
A (or excess demand) exists when the price is below the equilibrium price. At that low price, quantity demanded exceeds quantity supplied (Qd > Qs). Some buyers go away empty-handed.
What happens next:
- Stock sells out faster than sellers can restock. Queues form.
- Sellers, realising they can charge more, raise the price.
- As the price rises, quantity demanded contracts (a movement up the demand curve) and quantity supplied extends (a movement up the supply curve).
- The market returns to equilibrium at the higher price.
In both cases, the price moves toward the equilibrium automatically through buyer and seller behaviour. No central authority has to fix it.
Memorise the rule: price below equilibrium → shortage; price above equilibrium → surplus. The two are not interchangeable, and the direction matters.
Common exam question
Removing a shortage or a surplus
Question: A market has a surplus or a shortage; choose the change that would bring it back to equilibrium (1 mark, multiple choice).
Set in 2 of the 13 multiple-choice papers. A surplus is removed by a fall in price: quantity demanded extends and quantity supplied contracts. A shortage needs a rise in price, so the helpful fall is in quantity demanded, not price. Every wrong option widens the gap: a higher price, less demand or more supply for a surplus; a lower price, less supplied or fewer firms for a shortage.
Asked in 1 of the 11 structured papers, as a 4-mark explanation of how a market returns to equilibrium. Cover both cases: a shortage makes the price rise, a surplus makes it fall. Each situation and price movement can earn a mark, as can demand and supply becoming equal again. One mark is for referring to the price change; a diagram earns at most 2.
4. Reading equilibrium and disequilibrium from a demand-and-supply schedule
A demand-and-supply schedule is a table that lists, for each price, the quantity demanded and the quantity supplied. The equilibrium price is the row where the two columns are equal.
Take this schedule for the market in bicycle helmets:
| Price ($) | Quantity demanded (thousand units) | Quantity supplied (thousand units) |
|---|---|---|
| 10 | 90 | 30 |
| 20 | 75 | 45 |
| 30 | 60 | 60 |
| 40 | 45 | 75 |
| 50 | 30 | 90 |
Notice the shape of the two quantity columns: as the price rises, quantity demanded falls and quantity supplied rises, exactly as the demand and supply curves in topics 4 and 5 predict.
Finding the equilibrium. Look for the single row where the two quantity columns are equal. Here that is the $30 row, where Qd = Qs = 60. So the is $30 and the is 60 thousand units. Always give both the price and the quantity: a schedule question can go on to ask for something that needs both, such as the change in sellers' total revenue when supply shifts.
A row below the equilibrium price gives a . At $20, quantity demanded (75) is greater than quantity supplied (45), so the market is in disequilibrium. The size of the shortage is the gap between the two columns:
shortage = Qd − Qs = 75 − 45 = 30 thousand units
Buyers compete for the limited stock, so the price rises from $20 toward $30 and the shortage is eliminated.
A row above the equilibrium price gives a . At $50, quantity supplied (90) is greater than quantity demanded (30), so sellers are left with stock they cannot sell:
surplus = Qs − Qd = 90 − 30 = 60 thousand units
Sellers cut the price to shift that stock, so the price falls from $50 back toward $30.
This is the same story as section 3, told in numbers instead of curves. A row below the equilibrium row is the excess-demand diagram and a row above it is the excess-supply diagram, so whichever form a question uses, the rule is unchanged: price below equilibrium gives a shortage, price above equilibrium gives a surplus.
5. Effects of shifts in demand or supply on equilibrium
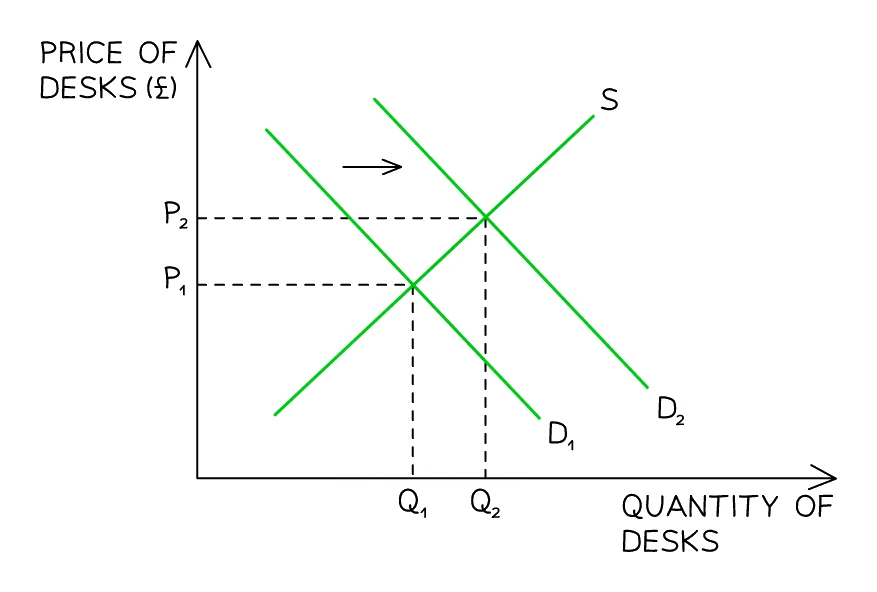
The conditions of demand (topic 4) and supply (topic 5) can change at any time. Any shift in either curve moves the equilibrium price and quantity. There are four basic cases. The diagram above shows one of them: an increase in demand shifts the demand curve right, pushing both the equilibrium price and quantity up.
| Shift | Effect on equilibrium price | Effect on equilibrium quantity |
|---|---|---|
| Demand shifts right (increase in demand) | Rises (P ↑) | Rises (Q ↑) |
| Demand shifts left (decrease in demand) | Falls (P ↓) | Falls (Q ↓) |
| Supply shifts right (increase in supply) | Falls (P ↓) | Rises (Q ↑) |
| Supply shifts left (decrease in supply) | Rises (P ↑) | Falls (Q ↓) |
Two patterns to memorise:
- A shift in demand moves price and quantity in the same direction (both up or both down).
- A shift in supply moves price and quantity in opposite directions.
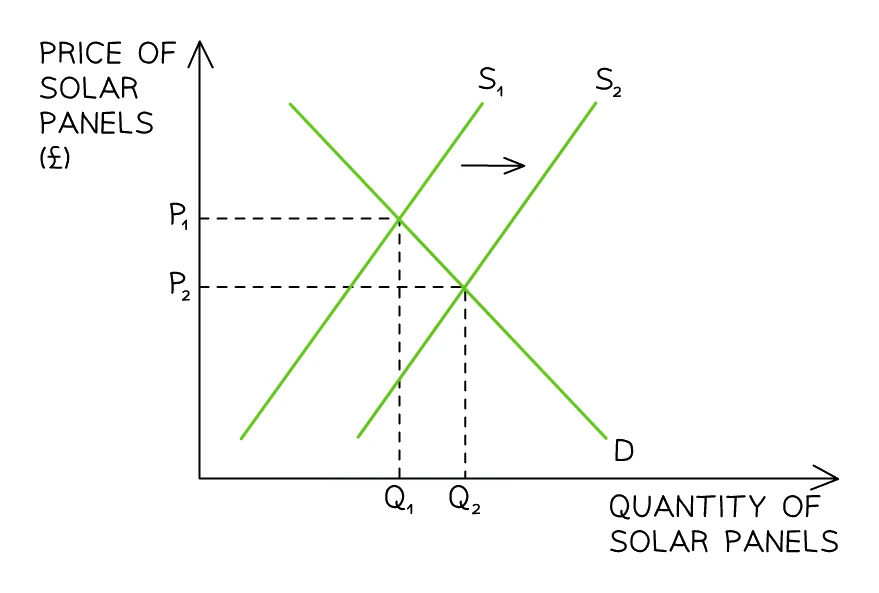
Causes and consequences of price changes
The four cases above are the causes of a price change: the equilibrium price moves only because a condition of demand or a condition of supply has changed and shifted one of the curves. A rise in demand or a fall in supply pushes the equilibrium price up; a fall in demand or a rise in supply pulls it down.
The consequence of that price change shows up in the quantity actually traded (the good's sales). Because a curve has shifted, the new equilibrium sits at a different quantity, and the size of that change in sales depends on how responsive the other side of the market is.
- A higher equilibrium price (from a demand rise or supply fall) is matched by a larger quantity traded when demand rises, but a smaller quantity traded when supply falls.
- A lower equilibrium price (from a demand fall or supply rise) is matched by a smaller quantity traded when demand falls, but a larger quantity traded when supply rises.
A useful way to read this: the price change is the visible signal, and the change in sales is the real-world effect it produces in the market. The four-case table above tells you both at once.
Common exam question
Working out what moved a price
Question: Choose how a market change affects the price, or what could have caused a price change (1 mark, multiple choice).
Set in 8 of the 13 multiple-choice papers. Only changed conditions of demand or supply move a free-market price. Decide which curve moves and which way: more demand or less supply raises the price, less demand or more supply lowers it. Higher incomes or a dearer substitute explain a rise; a crop failure causes a shortage and a higher price, lasting until other suppliers produce more. Wrong options push the other way (cheaper raw materials, a dearer complement).
With a schedule, shift the column at every price and find the new matching row; the old price no longer clears.
Asked in 1 of the 11 structured papers, as a 6-mark analysis of why a price rose: credit goes to demand causes (popularity, a dearer substitute, a cheaper complement, higher incomes) and supply causes (higher costs such as wages).
A seven-step structure for "analyse" questions
Structured questions that ask for a demand and supply diagram of a market change are worth 4–5 marks, and four of those marks are for the diagram (see the box below). Use this structure to work out what the diagram must show and what to write. It works for any shift in any market.
Step 1. Decide which side of the market the scenario affects: demand or supply.
Step 2. State which curve shifts and in which direction (e.g. "D shifts right from D₁ to D₂").
Step 3. At the original price, name the disequilibrium that now exists (surplus or shortage).
Step 4. State whether sellers raise or lower the price to clear the disequilibrium.
Step 5. Explain the contraction or extension of the other curve that follows the price change.
Step 6. Identify the new equilibrium (P₂, Q₂).
Step 7. Compare the new equilibrium to the original and conclude whether price and quantity have ended up higher or lower.
Common exam question
Drawing the effect of a change on a market
Question: Draw a demand and supply diagram to show how a change affects a market, or analyse the change using one (4–5 marks).
Asked in 8 of the 11 structured papers. The diagram earns four marks, one each for: both axes labelled (price, quantity); the original curves labelled D1 and S1; the new curve shifted in the correct direction (D2 or S2); and both equilibria shown, by lines to P1, Q1 and P2, Q2 or by points E1 and E2. The specimen mark scheme does the same for 2027.
Decide which curve moves first. In the papers, news about buyers (incomes, a health report, population, a related good's price) moved demand; news about producers (a drought, wages, a subsidy) moved supply. Use one diagram: one scheme lets an answer split over two diagrams keep three marks, but not the equilibrium mark.
The 5-mark analyse version adds one written mark: link the event to the shift and the new price.
When both demand and supply shift
If both curves shift at the same time, one of the two equilibrium effects becomes ambiguous and depends on the relative size of the two shifts.
| Both shifts | Definite effect | Ambiguous effect |
|---|---|---|
| D right + S right | Q ↑ (definite) | P depends on which shifts more |
| D left + S left | Q ↓ (definite) | P depends on which shifts more |
| D right + S left | P ↑ (definite) | Q depends on which shifts more |
| D left + S right | P ↓ (definite) | Q depends on which shifts more |
Both-curve analysis is only occasionally required, but the rule is: one of P or Q is determined; the other is "ambiguous" and depends on relative shift size.
Common exam question
When demand and supply shift together
Question: Demand and supply change at the same time; choose the shifts that explain a new price or equilibrium point, or the result that must follow (1 mark, multiple choice).
Set in 3 of the 13 multiple-choice papers. Move each curve on its own, then combine them: only an effect that both shifts push the same way is certain. When demand and supply both increase, the quantity traded must rise, but the price could go either way, so options saying the price must rise or must fall are wrong. A boom among buyers at the same time as a problem for sellers, such as too few lorry drivers to make deliveries, shifts demand right and supply left, and that must raise the price.
On a diagram, compare the new point with the old: a higher price with little change in quantity needs demand to rise and supply to fall.
6. The three functions of the price mechanism
The price mechanism is the system by which prices, set by demand and supply, allocate scarce resources in a market economy. Prices do three distinct jobs.
Signalling
The signalling function: prices act as signals that tell producers and consumers how relatively scarce a good is, and how much it is wanted.
A rising price signals scarcity (or rising demand). Producers see it and switch resources toward that good; consumers see it and consider whether to substitute away.
A falling price signals abundance (or falling demand). Producers move resources elsewhere; consumers find more affordable options.
Incentive
The incentive function: prices give producers and consumers a reason to change their behaviour. A high price rewards producers who supply more and punishes consumers who buy.
Two parts to the incentive:
- High prices incentivise producers to supply more (higher profit margins) and consumers to buy less (the good is more expensive).
- Low prices incentivise consumers to buy more and producers to supply less.
The incentive function is the engine that turns the price signal into actual changes in production and consumption.
Rationing
The rationing function: prices ration scarce goods to those who are willing and able to pay. When supply is limited, the price rises until only consumers who value the good enough to pay are still buying.
How the three functions answer the three big questions
The three functions work together to answer the three big questions an economy faces (introduced in topic 1).
| Big question | Function of the price mechanism that answers it |
|---|---|
| What to produce? | Signalling: high prices show what consumers want; producers respond. |
| How to produce? | Incentive: high input prices push firms to find cheaper methods. |
| For whom to produce? | Rationing: the goods go to those willing and able to pay the equilibrium price. |
Together, these three functions are the reason a market economy can allocate millions of scarce resources without central planning.