Living Standards & Development Indicators
Economics revision notes · Cambridge (CIE) · 0455
1. What "living standards" mean
The standard of living is the quantity and quality of goods and services available to the typical citizen, plus the non-monetary dimensions of life: health, education, leisure, environment, safety and personal freedom.
Two parts of the definition matter for marks.
- Economic dimensions. Income, employment, housing, the kinds of goods households can afford to buy. Income matters but it is not the whole story.
- Non-economic dimensions. Health (e.g. life expectancy, infant mortality), education (years of schooling, literacy), leisure (working hours, time with family), environment (air quality, biodiversity), safety (crime, conflict) and political freedom.
A country with very high income but poor health, low life expectancy, high crime and severe pollution does not have a high standard of living in the full economic sense.
Standard of living vs economic growth vs economic development
The three terms are often confused. They mean different things.
| Concept | What it measures |
|---|---|
| Economic growth | A sustained rise in real GDP (the economy's output). A narrow, output-only measure. |
| Standard of living | The quantity and quality of goods, services and non-monetary aspects of life for the typical citizen. |
| Economic development | A broad concept covering growth plus improvements in education, health, equality, infrastructure and sustainability. |
Growth is a means to an end. Development is the broader goal. Standard of living is how that goal is felt in everyday life.
2. Real GDP per head and its limitations
Real GDP per head (also called real GDP per capita) is a country's real GDP, its total output adjusted for inflation, divided by its population. It is the most-used single indicator of average income and is often used as a proxy for living standards.
The formula:
Using the real figure is what makes comparison over time possible. A nominal GDP per head can rise purely because prices have risen, with no extra goods and services produced, so it would overstate the improvement in living standards. Deflating for inflation strips out the price effect and leaves genuine output per person. Real GDP per head is widely available and broadly correlated with most aspects of wellbeing. But as a measure of living standards, it has four well-known limitations.
Common exam question
Using GDP per head figures in multiple choice
Question: Say what GDP is divided by to get GDP per head, compare living standards in a table of indicators, or interpret a rise in real GDP per head (1 mark, multiple choice).
Set in 4 of the 13 multiple-choice papers. GDP per head is GDP divided by the total population, not the adult, working or dependent population. When a table gives GDP and population, divide first: the most populous country can have a large GDP yet the lowest figure per head, and a slightly longer life expectancy does not make up for that. With several indicators, find the country lowest (or highest) on all of them; settle a GDP-per-head tie with the other columns.
A rise in real GDP per head has price changes already taken out, so it says nothing about inflation, and as an average it cannot show that income became more evenly shared. The safe conclusion is that some people's living standards improved.
Limitation 1: It hides income inequality
Real GDP per head is an average. It says nothing about how the income is distributed. A country with $30,000 of real GDP per head could have:
- Almost everyone earning between $20,000 and $40,000 (broad-based prosperity), or
- A wealthy elite earning $200,000+ while most people earn $5,000 (high inequality).
Both produce the same headline figure, but the living standard of the typical citizen is wildly different. Using real GDP per head alone makes inequality invisible.
Limitation 2: It ignores non-monetary factors
GDP only counts goods and services traded for money. It misses:
- Quality of the environment (clean air, biodiversity, climate stability).
- Leisure time. Two countries with the same real GDP per head may have very different working-hour cultures; the country where people work fewer hours has more leisure but identical output per person.
- Health and life expectancy beyond what is paid for in healthcare.
- Safety and crime levels.
- Unpaid work (housework, child care, volunteering). These contribute to wellbeing but are not in GDP.
A higher GDP that comes from longer working hours, more pollution and higher crime is not really a higher standard of living.
Limitation 3: International comparisons are tricky
Comparing real GDP per head across countries requires converting one currency into another, usually via the exchange rate. Two problems arise:
- Exchange rates fluctuate. A country's real GDP per head in dollar terms can change sharply just because its currency moved, with no change in actual living standards.
- Cost of living varies. $10,000 buys far more in rural India than in central London. Raw exchange-rate conversions overstate the gap.
The fix is (PPP) adjustment.
Purchasing Power Parity (PPP) is a method of converting national incomes that adjusts for differences in the cost of living between countries, so that a given PPP-dollar buys roughly the same basket of goods everywhere.
PPP-adjusted real GDP per head is the proper figure to use for cross-country comparisons.
Limitation 4: It does not show the composition of output
GDP treats all output as equal. £1 billion of weapons production adds the same to GDP as £1 billion of healthcare. But the welfare impact is very different. A country whose GDP is growing because of military or pollution-intensive industries may not be improving its citizens' living standards at all.
A note on what real GDP per head is not doing wrong
Real GDP per head is not inaccurate as a measure of average income. The limitations are about what it leaves out, not about errors in the calculation.
Common exam question
Real GDP per head as a measure of living standards
Question: Explain how real GDP per head can show living standards, or discuss whether people in high-GDP countries are better off than those in low-GDP ones (2–8 marks).
Asked in 2 of the 11 structured papers. For the 2-mark explanation, link two points: being real and per head, the figure is adjusted for inflation and population, in effect average income, and that income decides how much people can consume, necessities included. Arguing from a low figure counts too.
The 8-mark Discuss is marked by levels, and the top level needs both sides developed. For: more and better goods, housing, nutrition and healthcare (so longer lives) and education leading to better jobs. Against: high total GDP need not mean high GDP per head; income may be unevenly spread, leaving some in poverty; a large informal sector means GDP under-records income; prices may be higher; output may bring long hours, stress, pollution and congestion; and wants can outgrow incomes.
3. The Human Development Index (HDI)
The Human Development Index (HDI) is a composite index (combined single-number score) that captures three dimensions of human development: income, health and education. Each country gets an HDI score between 0 and 1; higher = more developed.
The three components
| Component | What it measures | Captures... |
|---|---|---|
| GNI per capita (PPP-adjusted) | Average income per person | The economic dimension |
| Life expectancy at birth | Number of years a newborn can expect to live | The health dimension |
| Education | Mean years of schooling for adults + expected years of schooling for children | The education dimension |
The three are combined into a single score by the United Nations Development Programme (UNDP) each year. Countries are then ranked into very high, high, medium and low human development categories.
Common exam question
Naming the HDI's components
Question: Identify the HDI's components, the measure that is not one of them, what the HDI covers that real GDP does not, or what it indicates (1 mark, multiple choice).
Set in 4 of the 13 multiple-choice papers. The three components are life expectancy at birth, years of schooling (mean and expected) and GNI per head. The papers set look-alikes that are not components: total GNI instead of GNI per head, adult literacy, population size or growth, doctors per head, and the spread of incomes, which the HDI ignores just as GDP per head does. What the HDI adds to real GDP is life expectancy and schooling, not trade, output or unemployment. Asked what the HDI indicates, the keyed answer is living standards, with economic development among the wrong options.
Why HDI is a better measure than real GDP per head alone
HDI directly addresses the second of the four limitations of real GDP per head, the non-monetary factors, in two ways.
- It includes health (life expectancy), capturing the non-monetary "you can be rich but unhealthy" dimension.
- It includes education, recognising that a society with high literacy and many years of schooling has higher human capital and broader life chances.
Both health and education matter for living standards in their own right; they are not just inputs to higher future GDP. A country with high GDP but poor health and low schooling will have a noticeably lower HDI than its GDP rank suggests.
Limitations of HDI
HDI is broader than real GDP per head but is not perfect.
- It still ignores inequality unless the inequality-adjusted version (IHDI) is used.
- It does not capture gender equality, environmental sustainability or political freedom directly.
- It puts equal weight on its three components, which is a normative choice.
- It depends on data quality, which is weaker in some developing countries.
Common exam question
Using the three components to explain HDI values
Question: Explain two ways an event such as flooding could lower a country's HDI, or analyse the relationship between life expectancy and HDI values in a table (4 marks).
Asked in 2 of the 11 structured papers. For the two ways, use a different component for each, with one mark for the way and one for its explanation: damaged schools cut years of schooling, spreading disease cuts life expectancy, and lost farmland or roads cut incomes and so GNI per head. An explanation that links two ways, such as illness keeping children out of school, is also accepted.
For the relationship, say that it is positive, back it with named countries, and explain it: life expectancy is one of the three components, a third of the index. Then name a country that breaks the pattern and explain it through the other two components, education and income. Copying figures out of the table earns nothing.
4. Why living standards differ between and within countries
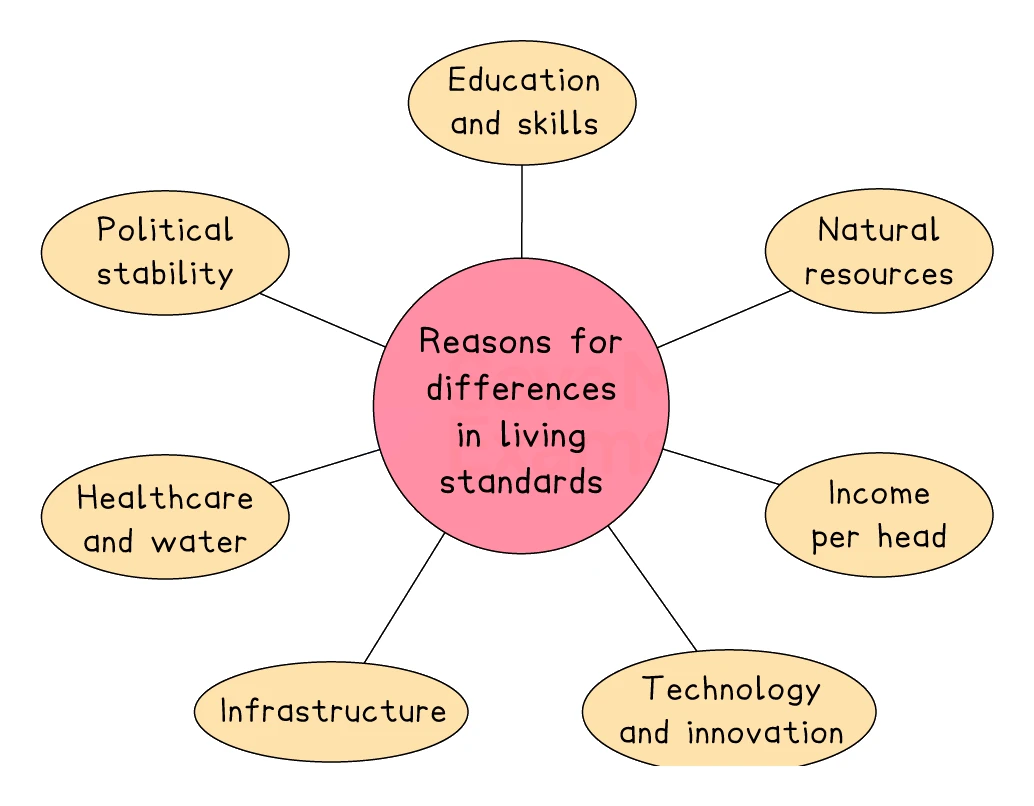
A 4-mark question on what influences living standards asks for two factors, with one mark for naming each and one for explaining it. Most of the reasons below compare one country with another; the last group explains why living standards also vary inside a single country.
Income and productivity differences
Richer countries can afford more goods, services, healthcare and education. The underlying cause is usually higher productivity (output per worker), driven by:
- More capital per worker (machines, infrastructure).
- Better technology.
- Higher human capital (education, training).
- Larger or more efficient markets.
Quality of human capital (education and healthcare)
Countries with good schools, universities and healthcare produce a workforce that is more productive and healthier. Both feed back into still higher productivity, in a virtuous cycle. Conversely, countries with weak education and high disease burden are trapped in low-productivity equilibrium.
Natural resources and technology
Two distinct paths to high living standards:
- Resource-rich countries (Norway with oil, Australia with minerals, Saudi Arabia with oil) can fund high public services from resource revenues.
- Technologically advanced countries (South Korea, Japan, Germany) export high-value manufactured goods and services that command high prices.
A country with neither (limited resources and low technology) finds it harder to lift living standards.
Political stability, governance, and institutions
- Stable politics encourages investment.
- Low corruption means public spending actually reaches public services.
- Strong rule of law protects property rights and contracts.
- Lower income inequality spreads the benefits of growth more widely.
- Effective government runs schools, hospitals and infrastructure well.
Even a country with abundant resources can have low living standards if its institutions are weak (the "resource curse").
Demographics and population structure
Countries with a large dependency ratio (many children and elderly per working-age adult) spread their output thinly. Countries with a healthy working-age share have higher per-capita output. Pop-growth differences also matter: if population grows faster than GDP, real GDP per head falls.
Why living standards differ within a country
The same national average hides big gaps between regions and between groups of people inside a single country.
- The urban-rural gap. Towns and cities usually have better infrastructure, more schools and hospitals, and a wider choice of higher-paid jobs. Rural households can therefore have a lower standard of living even where money incomes look similar.
- Regional economic differences. Industry, natural resources or access to a major port tend to concentrate in particular regions, so those regions have higher incomes and better-funded local services, while a region whose main industry has declined falls behind.
- Unequal access to public and merit goods. The quality of state healthcare and education varies from area to area and from group to group, so two households on the same income can still end up with very different health, schooling and quality of life.
Common exam question
What makes living standards higher or lower
Question: Explain two factors affecting living standards, or analyse or discuss why one group is worse off than another (4–8 marks).
Asked in 3 of the 11 structured papers. In the 4-mark version each factor earns a mark and its explanation a second; reasons in either direction count. Credited factors include income, education, healthcare, cost of living, working hours, sanitation, pollution, public and merit goods, and crime, each tied to its effect: more goods, better jobs, less illness, more leisure. The HDI is accepted when tied to GDP per head, education or health.
To analyse why low-income farmers are badly off (6 marks), build chains from the low income: necessities take most of it, so poor housing, food and healthcare bring illness and shorter lives, with little saving or education. To discuss city against rural life (8 marks, levels), weigh more jobs, higher incomes and nearer schools and healthcare against congestion, overcrowding, pollution, stress and a higher cost of living.
5. Income distribution within and between countries
The syllabus asks for the reasons living standards and income distribution differ both between countries and within a single country. The living-standards half of that bullet is covered above. Income is the other half: it is rarely shared out evenly within a country, and how unequally it is shared shapes the living standard of the typical person.
Income within a country is distributed unevenly for several reasons.
- Differences in skills and education. Workers with scarce, highly valued skills command much higher wages than those with few qualifications.
- Differences in wealth ownership. Households that own property, shares or businesses receive income from those assets on top of any wages, widening the gap.
- Unemployment and ill health. Households with no earner, or with members unable to work, fall to the bottom of the distribution.
- The tax and benefit system. Progressive taxes and state benefits narrow the gap; a system that taxes the poor heavily and spends little on transfers widens it.
A useful summary measure is the , a score from 0 (everyone has an equal income) to 1 (one person has all the income). You are not required to name it at IGCSE. Two countries with the same GDP per head can have very different Gini coefficients, and the one with the more even distribution usually has the higher typical living standard, because the average is not pulled up by a wealthy few while most people earn little.
Common exam question
Reading a table of income shares
Question: Use a table of the share of income going to each fifth of households, over two years or across countries, to judge how equal the distribution is (1 mark, multiple choice).
Set in 2 of the 13 multiple-choice papers. Each group is always a fifth of households, so changing shares never mean more households joined the top group. Income has become less equal when the top fifth's share rises and the bottom fifth's falls. It is most equal where the shares sit closest to 20% each: a country whose top fifth gets 40% and bottom fifth 10% is more equal than one at 55% and 4%.
Shares are percentages of each country's own income and show nothing about how much anyone earns: a smaller share for one country's poorest fifth does not make them poorer than another country's, and shares alone cannot show absolute poverty. When an option groups two fifths, add their shares before comparing.