1. What inflation is
Inflation is a sustained rise in the general level of prices in the economy over time. The rate measures how fast prices are rising as a percentage of the previous period.
Three points to remember:
- Sustained. A one-off price rise (e.g. a sudden tax increase one quarter) is not inflation. Inflation is ongoing.
- General price level. Inflation is about all prices on average, not the price of one good. A rise in the price of bananas alone is not inflation; a rise in the average of food, rent, energy, transport, clothing and so on is.
- Real-world reality. Some inflation is normal in any growing economy. The aim (topic 12) is low and stable inflation, not zero.
A related concept worth naming:
Deflation is a sustained fall in the general price level, which shows up as a negative inflation rate.
2. The two main causes of inflation
The syllabus splits inflation into two types according to its underlying cause.
Demand-pull inflation
Demand-pull inflation is caused by excessive aggregate demand in the economy, meaning too much total spending relative to what the economy can produce. Often summarised as "too much money chasing too few goods".
When aggregate demand (AD) rises faster than aggregate supply (AS), firms cannot ramp up output quickly enough to meet the extra spending. They respond by raising prices to ration their limited output to the most willing buyers.
Typical causes of rising AD:
- Cuts in interest rates that lower the cost of borrowing for households and firms.
- Tax cuts that leave households with more disposable income.
- Higher government spending on infrastructure, public services, or transfers.
- A consumer or housing boom in which households spend more out of confidence.
- Higher exports triggered by strong demand abroad.
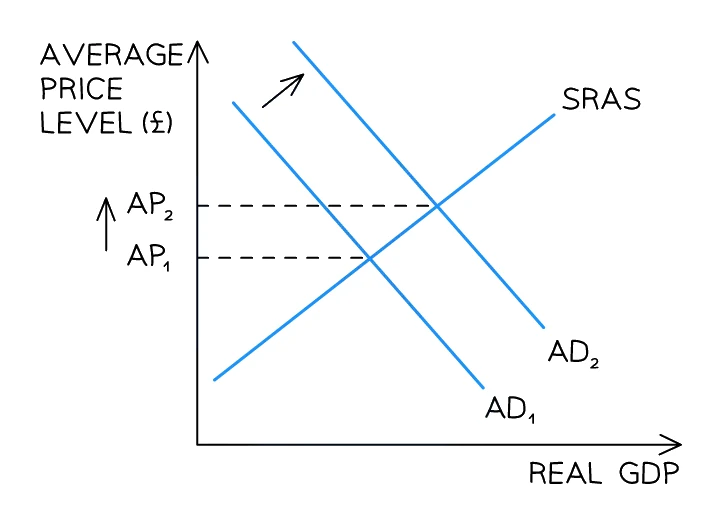
On an AD-AS diagram, demand-pull inflation appears as the AD curve shifting right (AD₁ to AD₂) against a fixed SRAS curve, raising the average price level from AP₁ to AP₂ and increasing real GDP.
Cost-push inflation
Cost-push inflation is caused by rising costs of production (such as higher wages, raw-material prices, or import prices) that firms pass on to consumers as higher prices.
The mechanism: firms see their per-unit cost rise; to keep profit margins acceptable, they raise selling prices. Households and other firms then pay more for everything that uses those inputs.
Typical causes of rising costs:
- A rise in world oil or gas prices that flows through every transport- and energy-using industry.
- Wage rises that exceed productivity gains (sometimes called wage-push inflation).
- A fall in the exchange rate that raises the price of imported raw materials ().
- A rise in indirect taxes (e.g. VAT, fuel duty) that producers add to retail prices.
- A supply shock: a war, disaster or pandemic that disrupts supply chains.
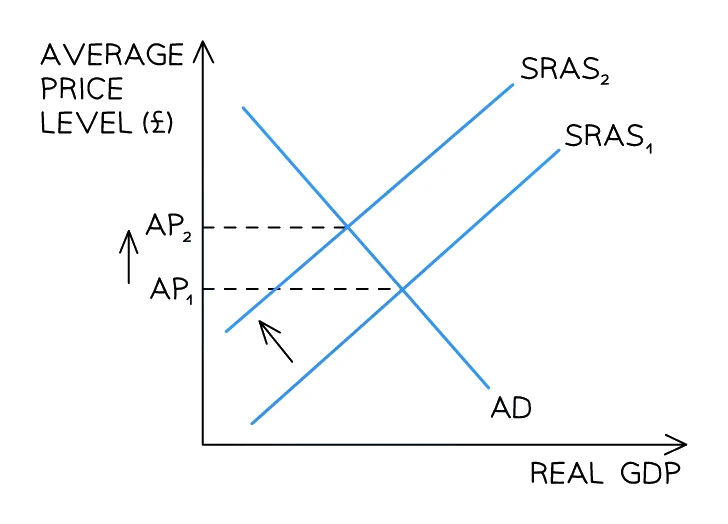
On an AD-AS diagram, cost-push inflation appears as the (short-run) AS curve shifting left (SRAS₁ to SRAS₂) against a fixed AD curve, raising the average price level from AP₁ to AP₂ but reducing real GDP at the same time (called when severe).
Demand-pull vs cost-push at a glance
| Demand-pull | Cost-push | |
|---|---|---|
| Underlying driver | Too much spending (high AD) | Higher production costs |
| What happens to AD/AS | AD shifts right | AS shifts left |
| Effect on real GDP | Rises | Falls |
| Effect on employment | Rises (more output, more jobs) | Falls (firms cut output) |
| Typical real-world trigger | Tax cut, rate cut, export boom | Oil-price spike, weak currency, wage surge |
Common exam question
Explaining what causes inflation
Question: Explain the type of inflation in the data, or explain, analyse or discuss why a country's inflation rate rises or falls (2–8 marks).
Asked in 4 of the 11 structured papers. Tie each cause to one of two routes: higher total demand (demand-pull) or higher costs of production (cost-push). Naming the type earns a mark and the cause in the data a second, such as dearer energy raising firms' costs. Each of two reasons earns a mark, and its explanation another: "consumers spent less" earns one, "so total demand fell" the other. Weaker wage bargaining and higher unemployment lower inflation by the same routes.
In a 6-mark analysis, chain the links: more tourists raise demand for food and rooms, lifting prices (demand-pull), and hotels hiring extra staff push up wages and costs (cost-push). Whether inflation will fall needs both sides: new technology, more productive workers and foreign competition against more spending, lower interest rates, or dearer energy and food.
3. Effects of inflation on different groups
Inflation is redistributive: it harms some people and helps others.
Savers and lenders (usually lose)
Savers earn a nominal interest rate on their deposits. The real return is:
Real interest rate ≈ nominal interest rate − inflation rate
If inflation is 5% and a savings account pays 2%, the real interest rate is −3%. The saver's money is losing purchasing power even while the bank balance grows in pounds. Savers are made worse off whenever inflation exceeds the rate on their accounts.
A lender is in the same position as a saver. When inflation is higher than the nominal rate charged on a loan, the real value of both the sum repaid and the interest received falls, so the lender gets back less purchasing power than they gave up. That loss is the exact mirror of the borrower's gain below.
Borrowers (usually gain)
Borrowers repay loans in money that is worth less than when they took them out. If a household borrows £100,000 at a fixed rate to buy a house, and inflation runs at 5% per year for several years, the real value of the debt falls even though the nominal amount is unchanged. Mortgage holders and other long-term borrowers tend to benefit from inflation, especially when their loans were taken out at fixed nominal rates.
Common exam question
Who gains from inflation
Question: Choose the group most likely to be better off when prices are rising quickly (1 mark, multiple choice).
Set in 4 of the 13 multiple-choice papers, and the answer each time is the borrower: a debtor, or anyone repaying a loan at a fixed rate of interest, pays back money that buys less than it did when it was borrowed. The other options are groups that lose: savers and lenders, whose money and interest buy less; people on fixed incomes or fixed state benefits; pensioners; holders of cash; exporters, whose goods become dearer abroad; and foreign tourists. When two options both mention a fixed rate of interest, check which one is borrowing and which is lending.
One more paper turns it round and asks what rises as inflation speeds up from a low rate: the cost of changing price lists (menu costs). Business confidence, the real income of fixed-income earners and the real value of debts all fall.
Consumers (lose)
- Real income falls. A given money income buys less as prices rise, so purchasing power is eroded and consumers can afford a smaller quantity of goods and services.
- Living standards are squeezed whenever pay rises lag behind price rises (see the workers sub-section below).
- Budgeting and planning become harder when prices are volatile: consumers cannot predict what their weekly shop or energy bill will cost, so saving and spending decisions are made with far less certainty.
- Shoe-leather costs rise: consumers spend more time and money shopping around for the best prices as prices change frequently.
Workers on fixed wages or pensions (lose)
A worker on a wage that does not rise with prices sees their real wage fall: the same paycheque buys fewer goods. Pensioners on fixed nominal pensions are particularly vulnerable: many state pensions are now index-linked (rising with inflation) for exactly this reason. Private-sector workers in strong unions tend to negotiate -linked pay rises to protect their real wages.
Exam tip
Compare pay rises with the inflation rate
Real income rises only when pay grows faster than prices, so set each percentage pay rise against the inflation rate: 10% pay with 8% inflation gains less than 6% pay with 2%, so the biggest pay rise is not always the biggest real gain. One scheme credits real wages rising while pay outpaced prices and falling once inflation overtook it, and notes that a smaller wage rise is still a rise.
Prices work the same way: inflation falling from 6% to 2% means prices still rise, only more slowly, and 100% inflation means money buys half as much.
Exporters (lose competitiveness)
If a country's inflation rate is higher than its trading partners', the prices of its exports rise relative to the world average. Foreign buyers switch to cheaper alternatives, and the country's current account (topic 31) deteriorates. Exporters lose market share unless they can absorb the cost rises or cut their margins.
Firms (mixed)
- Predictable, low inflation is broadly fine for firms: they can plan, invest and price ahead.
- High, volatile inflation is harmful: firms cannot easily predict input costs or set selling prices; investment falls because the future is uncertain.
- Firms with pricing power (inelastic demand) can pass cost rises on easily; firms in highly competitive markets are squeezed.
The economy as a whole
- Investment falls when inflation is high and unpredictable, because firms cannot assess future returns reliably.
- rise: shops, restaurants and other firms spend more time and money repricing.
- International confidence falls, which can push the currency down and feed even more imported inflation.
- Confidence in money erodes when inflation is very high: people are less willing to hold the currency as a store of value, and may switch to foreign currency.
Common exam question
How inflation affects economic growth
Question: Explain two reasons why low inflation can raise a country's growth rate, or discuss whether high inflation means low growth (4–8 marks).
Asked in 2 of the 11 structured papers. In the 4-mark version each reason earns a mark for naming it and a mark for explaining it. Low inflation keeps the country's products internationally competitive, so it sells more exports and buys fewer imports; it gives firms certainty, which encourages investment and attracts multinationals; it keeps cost increases and wage claims down; and it builds confidence, so spending rises.
The 8-mark discussion needs both sides developed for the top level. Inflation caused by rising total demand (demand-pull) can come with rising output, whereas cost-push inflation can cut it. Extra tax revenue can pay for education that lifts growth later, inflation lowers the real cost of borrowing, which can raise spending and investment, and competitiveness depends on inflation compared with rival countries', not on the rate alone.
4. Measuring inflation: the Consumer Price Index (CPI)
The Consumer Price Index (CPI) is a weighted index that tracks the average price of a representative basket of goods and services that a typical household buys. The percentage change in the CPI from one period to the next is the rate.
How the CPI is constructed
Three steps the statistical agency takes.
Step 1: choose the basket. Statisticians survey thousands of households to find out what they actually spend their money on. The basket is then a representative selection: food, rent, transport, energy, clothing, entertainment, services, and many more sub-categories.
Step 2: apply weights. Items are weighted by their share of household spending. Rent and food typically have very large weights; restaurant meals and overseas holidays have smaller weights. So a 10% rise in rent has more impact on the CPI than a 10% rise in cinema tickets.
Step 3: record prices. Statisticians record the price of every item in the basket each month, in many locations. The weighted average is calculated to give the index value.
The basket and weights are updated periodically (usually annually) to reflect changing consumption patterns. New items are added; outdated items are removed.
Common exam question
Reading the weights in a consumer prices index
Question: Choose the conclusion that a table of CPI weights for two years supports (1 mark, multiple choice).
Set in 2 of the 13 multiple-choice papers. A weight is the share of household spending that goes on an item, so the only safe conclusion is about proportions: when an item's weight rises, a larger proportion of income is spent on it. The wrong options read a weight as a price (the item became dearer or cheaper, or the price level stayed the same) or as an amount of money (people spent more or less on it). The weights show neither: a share can rise while spending on the item falls, if total spending falls faster, and they say nothing about living standards.
A third paper asks which item the basket would leave out. The CPI tracks what households buy, so clothes made at home for the family's own use are not in it.
Calculating the inflation rate
rate (%) = ((new CPI − old CPI) ÷ old CPI) × 100
Worked example
Calculating the inflation rate from two CPI values
A country's Consumer Prices Index stood at 120 at the start of the year and rose to 138 by the end of the year.
Solution:
- Change in index = 138 − 120 = 18
- Divide by the starting value: 18 ÷ 120 = 0.15
- Multiply by 100 to express as a percentage: 0.15 × 100 = 15%
- The inflation rate over the year was 15%
The index rose 18 points but prices rose 15%: a change in index points equals a percentage change only when the old index is 100, so always divide by the old value. When this was set as a multiple-choice item, the wrong options were the points change and the two index values themselves.
Limitations of the CPI
- The "average household" does not exist. The CPI is built from the spending pattern of a typical household, so it misstates the inflation rate faced by any household whose basket differs from that average. When food and energy prices rise faster than average, low-income households (who spend a larger share of their income on them) face a higher inflation rate than the headline CPI shows.
- The basket cannot capture quality improvements. A laptop today is far more powerful than one from a decade ago at a similar price; the CPI does not always reflect that.
- The CPI may not include owner-occupied housing costs correctly, leading to debates about its accuracy.
- It is backward-looking: the basket reflects past spending patterns, not the basket households would buy at today's prices.
5. Government policies to control inflation
The three families of macroeconomic policy each play a role.
Monetary policy: interest rates
The central bank (e.g. the Bank of England, the European Central Bank) raises interest rates to fight inflation.
Mechanism: higher interest rates discourage borrowing (mortgages, business loans, credit cards become more expensive) and encourage saving. Households spend less; firms invest less. Aggregate demand falls, which slows demand-pull inflation.
Monetary policy is the first-line tool against demand-pull inflation in most countries. It can be adjusted quickly (the central bank can vote to change rates every few weeks) and is reversed easily when inflation eases.
Limits:
- Interest-rate rises take months to a year to fully work through the economy.
- Higher rates also slow growth and raise unemployment in the short run, which is the conflict between low inflation and full employment covered in topic 12.
- Monetary policy works mainly on demand-pull inflation; it reaches cost-push inflation only indirectly, through firms' borrowing costs and the exchange rate.
Fiscal policy: taxes and government spending
The government uses contractionary fiscal policy to fight inflation: raise taxes or cut public spending, reducing aggregate demand.
Two arms:
- Higher taxes (income tax, VAT) leave households with less to spend.
- Cuts in government spending reduce demand directly.
Both shift AD to the left, slowing demand-pull inflation.
Limits:
- Fiscal policy is slow to change. Tax laws take months to legislate; spending plans are usually set for years.
- Cuts can be politically painful: voters dislike higher taxes and reduced public services.
- Like monetary policy, fiscal contraction risks slowing growth and raising unemployment.
Supply-side policy: raising productive capacity
Supply-side policies lift the economy's productive capacity so that aggregate supply can keep pace with aggregate demand. They are the main response to cost-push inflation.
Examples:
- Education and training: better-skilled workers produce more output per hour at lower unit cost.
- Investment in infrastructure: better roads, ports, broadband cut firms' costs.
- R&D incentives: new technology raises productivity.
- Deregulation: easing rules that restrict competition or trade.
- Privatisation: sometimes argued to raise efficiency.
Supply-side policy is the long-run solution: it takes years to bear fruit, but lifts the economy's capacity permanently and eases the -growth trade-off.
Exchange-rate policy (special case)
If imported inflation is the problem, strengthening the currency (an appreciation of the exchange rate, e.g. via higher interest rates or government intervention in the foreign exchange market) makes imports cheaper, which directly lowers cost-push inflation. The downside is that exports become more expensive abroad, which can hurt the current account.