1. Types of firms
Firms can be classified in several ways. The syllabus expects you to know the two below, by sector of production and by ownership, and a third, by size, which section 2 covers.
By sector of production:
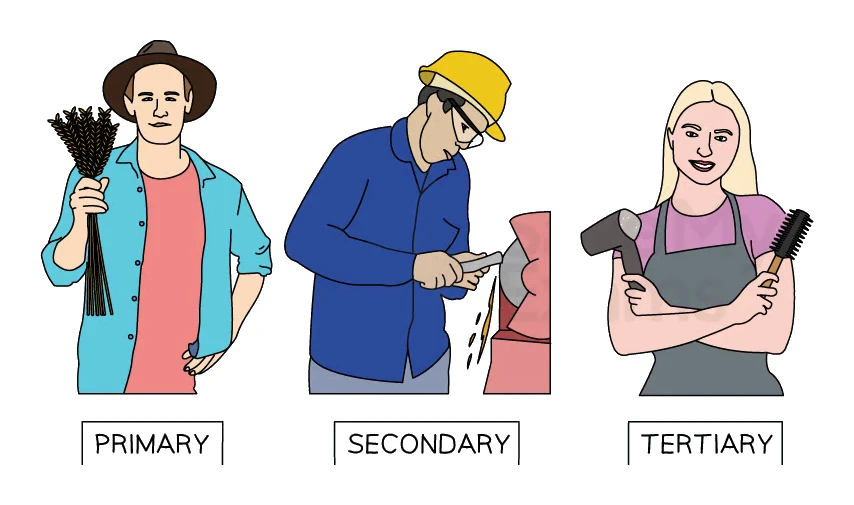
Primary-sector firms extract raw materials from nature (farming, fishing, mining, forestry).
Secondary-sector firms turn raw materials into finished or semi-finished goods (manufacturing, construction).
Tertiary-sector firms provide services (retailing, banking, transport, tourism).
By ownership:
Private-sector firms are owned by private individuals and usually aim to make a profit (sole traders, partnerships, companies).
Public-sector firms are owned and run by the government, often to provide an important service (state-owned utilities, public transport) rather than purely for profit.
Common exam question
Classifying firms by sector
Question: Define a sector with an example, name a sector's products, or explain two ways firms can be classified (2–4 marks).
Asked in 3 of the 11 structured papers. A definition earns a mark for the meaning and one for an example: the secondary sector manufactures, builds or processes raw materials; the tertiary sector provides services. Give one example, not one the question rules out: a scheme may credit only the first. Primary-sector products are raw materials such as fish, wheat or coal (fishing is accepted). To explain two ways firms are classified, name and explain each, a mark each: by stage of production (primary, secondary or tertiary), by ownership (private or public) or by size (output or number of workers).
Common exam question
Private and public sector firms
Question: Explain how the private and public sectors differ, or discuss whether private sector firms charge lower prices than public ones (4–8 marks).
Asked in 2 of the 11 structured papers. For the difference, give each sector's owner and aim, a mark each: private firms belong to individuals or firms and pursue profit; public firms belong to the government and pursue the welfare of society. The 8-mark Discuss weighs private firms' competition and cost cutting against their profit motive or monopoly power, and against public firms' subsidised prices.
2. Small firms and large firms
Some firms stay small, others grow large, and each has advantages and disadvantages.
| Advantages | Disadvantages | |
|---|---|---|
| Small firms | Flexible and quick to respond to changing tastes; can offer personal service; can serve niche markets too small for big firms; owner keeps full control | High average costs (cannot exploit economies of scale); harder to raise finance (less likely to get a loan from commercial banks, less retained profit); vulnerable to competition |
| Large firms | Lower average costs through economies of scale; easier access to finance and bulk-buying discounts; strong brand and market power; can spread risk across products | Risk of diseconomies of scale; harder to manage and coordinate; can be slow and bureaucratic; may lose the personal touch |
Many firms remain small by choice (the owner wants a manageable workload and full control) or because the market is small (a niche product, a personal service, low barriers to entry that keep many small rivals in the market).
Common exam question
Small firms against large firms
Question: Explain two advantages of a large firm, discuss whether small firms fail more often or benefit consumers (4–8 marks), or pick a small firm's advantage or drawback (1 mark, multiple choice).
Asked in 3 of the 11 structured papers. In the 4-mark Explain, each advantage earns a mark and its explanation another: economies of scale cutting average cost, easier bank loans, or a well-known brand. Two different economies of scale count as two. A Discuss needs both sides developed: small firms may have higher average costs, harder loans and less retained profit, yet thrive on flexibility, a personal service, a niche and less risk of diseconomies of scale; many small rivals can keep prices low.
Set in 4 of the 13 multiple-choice papers. A small firm gains communication and independence, not lower average cost, and lacks internal economies of scale (external ones depend on the industry). Small firms suit local markets, low entry costs and personal services.
3. Mergers
Two firms can join together in a merger, which makes the combined firm larger. The syllabus expects the three types of merger, with definitions.
A horizontal merger is a merger between two firms in the same industry and at the same stage of production (for example, two car manufacturers, or one supermarket chain buying another).
A vertical merger is a merger between two firms in the same industry but at different stages of production. Backward vertical means joining with a supplier earlier in the chain (a car maker buying a steel producer); forward vertical means joining with a distributor later in the chain (a car maker buying a dealership).
A conglomerate merger is a merger between two firms in completely different industries (a food company merging with an electronics firm), usually to diversify and spread risk.
Common exam question
Naming the type of merger
Question: Name the type of merger two firms are making, or pick the main reason for a merger of unrelated firms (1 mark, multiple choice).
Set in 5 of the 13 multiple-choice papers. Place both firms on the chain from raw material to consumer. Two firms making the same product at the same stage merge horizontally. Firms at different stages of one chain merge vertically: forward when the buyer takes over a firm nearer the consumer (a timber company buying a furniture maker), backward when it buys a supplier. So a manufacturer joining a retailer of the same product is vertical, not horizontal, and a bakery buying the app its customers order through is forward vertical, not conglomerate. Firms in unrelated industries make a conglomerate merger, whose main gain is diversification (spreading risk), not economies of scale or market share.
| Merger type | Main advantage | Main disadvantage |
|---|---|---|
| Horizontal | Larger market share and economies of scale | May create monopoly power and reduce competition |
| Vertical (backward) | Secures and controls the supply of inputs | The firm must manage an unfamiliar stage of production |
| Vertical (forward) | Secures outlets and control over how the product is sold | The firm must run retailing it may not be skilled at |
| Conglomerate | Spreads risk across different markets | Managers may lack expertise in the new industry |
Common exam question
Benefits and drawbacks of a merger
Question: Identify or explain a merger's benefits, explain why it may raise prices, analyse why one may be blocked or fail, or discuss encouraging mergers (2–8 marks).
Asked in 5 of the 11 structured papers. Credited benefits are economies of scale and lower costs, lower prices, higher quality when the firms pool their strengths, extra capital, higher profit and international competitiveness; higher revenue is not accepted. For the economy, take each a step further: lower prices raise output and jobs, better quality raises exports.
The drawbacks are monopoly power, so higher prices because consumers cannot switch, less choice and innovation, jobs lost through rationalisation, and diseconomies of scale from poor coordination, control or cooperation. Link any cost rise to those diseconomies or to the merger's own cost, not just to the firm being bigger. Asked why a government may block a horizontal merger, define it first: the mark needs both the same industry and the same stage of production.
4. Economies and diseconomies of scale
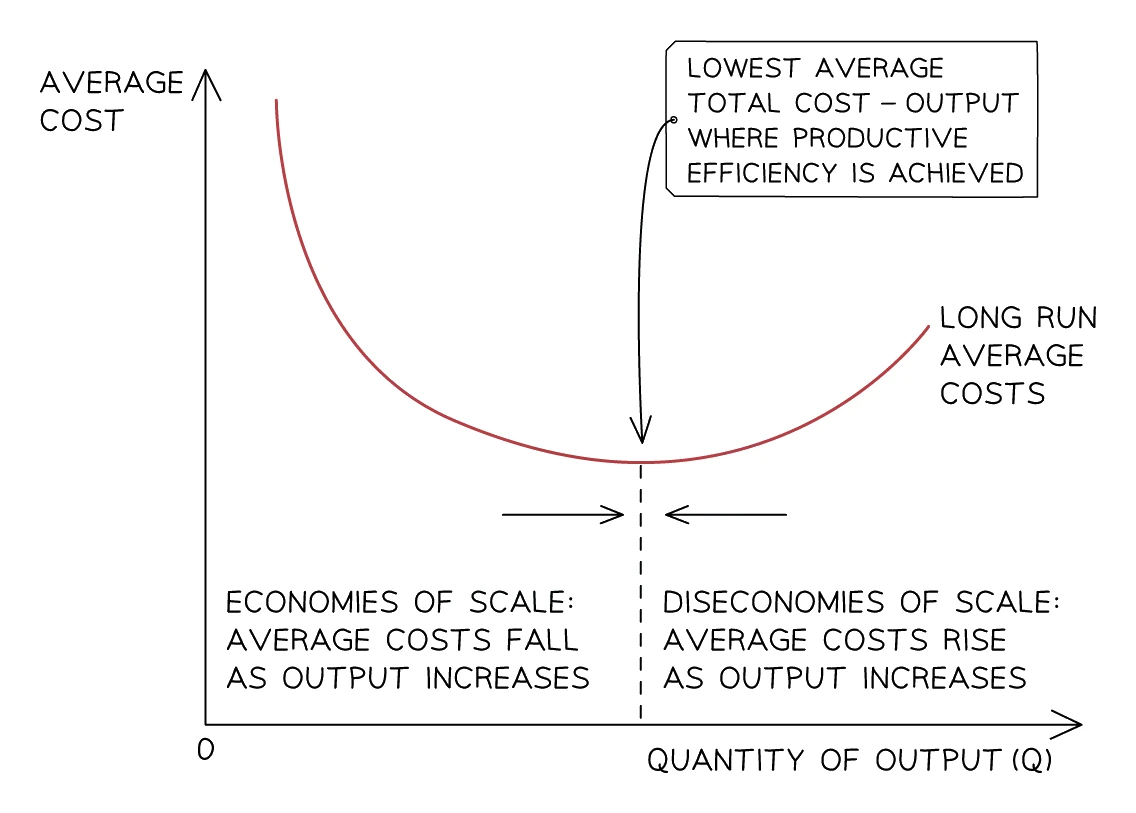
As a firm grows, its average total cost (ATC) typically falls for a while and then, beyond some point, starts to rise. On a diagram this gives a U-shaped average cost curve.
Standard layout of the ATC diagram in the exam:
- Horizontal axis: output (quantity produced per period).
- Vertical axis: average total cost (£ or $ per unit).
- Curve label:
ATC, drawn as a U shape that falls, flattens at its lowest point, then rises. - Range labels: the falling section is labelled , the rising section .
To interpret the diagram, find the bottom of the curve: average total cost is at its lowest at the output directly below it, so drop a dashed line from that point to the output axis and label it as the output with the lowest average total cost. To the left of it the firm is still gaining economies of scale, so expanding output lowers cost per unit. Moving rightwards past it takes the firm into diseconomies of scale, so expanding output now raises cost per unit.
Economies of scale are the fall in average total cost a firm enjoys as it grows in size and output.
Diseconomies of scale are the rise in average total cost a firm suffers once it becomes too large to run efficiently.
The lowest point of the ATC curve is where economies of scale stop and diseconomies of scale begin.
Internal economies of scale
These are cost savings a firm captures as it grows larger.
| Type | What it is |
|---|---|
| Technical | Larger, specialised machinery and longer production runs lower the cost per unit. |
| Financial | Big firms borrow at lower interest rates and can raise finance more easily than small firms. |
| Marketing | Advertising and branding costs are spread over a much larger output, so cost per unit sold is tiny. |
| Managerial | Large firms can employ specialist managers for finance, marketing and operations. |
| Purchasing | Bulk-buying raw materials earns discounts that small firms cannot get. |
| Risk-bearing | Large firms diversify across products and markets, so a bad year in one area is offset elsewhere. |
Internal diseconomies of scale
Beyond that point, problems begin to push average cost back up.
| Type | What goes wrong |
|---|---|
| Communication | Messages get distorted across more layers of management. |
| Coordination | A huge firm with many divisions struggles to keep everyone working to the same goal. |
| Control | Senior managers cannot oversee everything, so inefficiency creeps in. |
| Motivation | Workers feel like a small cog in a giant machine, so productivity falls. |
External economies and diseconomies
These affect all firms in an industry as the industry grows, not just one firm. External economies include a pool of skilled local labour, specialist suppliers locating nearby and shared infrastructure, all of which lower every firm's costs. External diseconomies include rising local wages, congestion and higher land prices as too many firms cluster in one area, which raise every firm's costs.
Common exam question
Internal or external, economies or diseconomies
Question: Pick the definition, cause or ATC diagram showing internal or external economies or diseconomies of scale (1 mark, multiple choice).
Set in 6 of the 13 multiple-choice papers. Ask two things. Whose output changed? The firm's own gives an internal effect; the whole industry's an external one. Did average cost fall or rise? A fall is an economy of scale, a rise a diseconomy. Internal effects move the firm along its ATC curve, so economies of scale show as more output at a lower cost; external effects shift the whole curve, down for external economies.
So technical or managerial economies and control problems never shift the curve. A merger that slows decisions is an internal diseconomy; a shortage of skilled labour in the area is external. Rival firms cluster to share external economies. Doubling every input for less than double the output signals diseconomies of scale, and internal diseconomies starting at low output explain why some firms stay small.
Worked example
Reading economies of scale from an ATC diagram
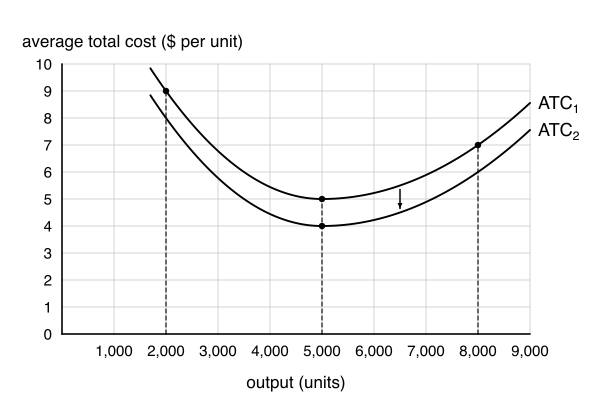
The diagram shows a firm's long-run average total cost curve, ATC1: ATC is $9 per unit at an output of 2,000 units, $5 at 5,000 units (the lowest point) and $7 at 8,000 units. Later, several specialist suppliers open near the firms in its industry, and the firm's curve moves to ATC2, on which ATC at 5,000 units is $4.
Describe and explain the change in ATC as output rises from 2,000 to 5,000 units and then to 8,000 units, and identify what moved the curve to ATC2.
Solution:
- From 2,000 to 5,000 units, ATC falls from $9 to $5, by $4 per unit. The firm moves down the falling part of ATC1, so it is gaining internal economies of scale, such as bulk-buying discounts.
- From 5,000 to 8,000 units, ATC rises from $5 to $7, by $2 per unit. Past the lowest point the firm meets internal diseconomies of scale, such as coordination problems.
- So 5,000 units is the output with the lowest ATC on ATC1.
- The suppliers cut costs for every firm in the industry, whatever its output, so the whole curve shifts down. That is external economies of scale, taking ATC at 5,000 units from $5 to $4 per unit.
A move along the curve is internal; a shift of the whole curve is external.