1. What demand is
Demand is the quantity of a good or service that consumers are willing and able to buy at a given price over a given time period.
Two words in the definition earn the marks.
- Willing. The consumer actually wants the product. Wanting is a necessary part of demand.
- Able. The consumer has the purchasing power to pay. Wanting a product without being able to afford it is not demand.
Demand backed by the ability to pay is sometimes called . A child who wishes she had a £400 phone but cannot pay £400 is not part of the demand for that phone. A wish without purchasing power does not count.
A definition that just says "what people want" or "how much consumers would like to buy" loses the second mark. Both willing and able must appear.
Demand is always measured over a time period (per day, per month, per year) and at a specific price (or across a range of prices). A statement like "demand for coffee is 5,000 cups" is incomplete; "demand for coffee is 5,000 cups per week at £3 per cup" is the correct form.
Exam tip
Define demand with both willing and able
Define demand as the quantity consumers are willing and able to buy at a given price over a period of time. The one scheme that marks the matching supply definition gives each half a mark, and an answer giving only the amount produced or available scores one. A multiple-choice item tests the same pair: if one group buys more than another at every price, the safe conclusion is that it is more willing and able to buy. Wanting the good more, being richer or being more numerous might explain the gap, but the figures alone show none of them.
2. The demand curve
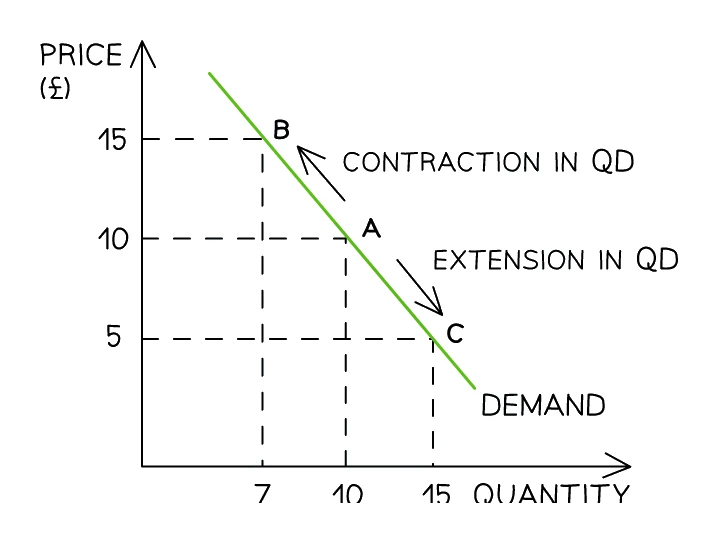
A plots the quantity of a good consumers are willing and able to buy (horizontal axis) against the price (vertical axis). In practice, exam diagrams use a straight line that slopes downward from upper-left to lower-right, even though real data would form a curve. The straight-line shortcut makes the diagram easier to draw and read.
Standard layout of every demand-curve diagram in the exam.
- Vertical axis: price (usually in £ or $ per unit).
- Horizontal axis: quantity demanded per period (e.g. units per week).
- Curve labels:
Dfor a single demand curve. When the curve shifts, label the originalD₁and the new curveD₂, whichever way it moves: the specimen mark scheme and most exam diagrams do this. (The figure in section 5 shows both possible shifts from one original curve, so it labels that curveD.)
3. The law of demand
The states that, holding all other factors constant (), as the price of a good rises, the quantity demanded falls; and as the price falls, the quantity demanded rises.
In one symbol: price and quantity demanded are inversely related (P↑ → Qd↓, P↓ → Qd↑), ceteris paribus.
Two intuitions behind the law:
- . When the good becomes more expensive, consumers switch to cheaper alternatives. When it becomes cheaper, they switch towards it.
- . A higher price effectively reduces a consumer's purchasing power (their income buys less of the good), and the lower-price effect is the reverse.
The ceteris paribus condition is essential. If income, tastes, or the price of a related good change at the same time as the good's own price, the simple inverse relationship may not show cleanly.
4. Movement along the demand curve
A change in the good's own price (and nothing else) produces a movement along the existing curve. The curve does not move; only the point on it moves.
The syllabus gives two specific names for these movements.
Extension of demand. When the price falls (P↓), the quantity demanded rises, and the point moves down and to the right along the curve.
Contraction of demand. When the price rises (P↑), the quantity demanded falls, and the point moves up and to the left along the curve.
Common exam question
Spotting an extension or a contraction in demand
Question: Define an extension in demand, or identify how a fall in a good's own price shows on its demand curve (2 marks).
Asked in 2 of the 11 structured papers. Credit goes to a movement along the demand curve, down it from left to right, named an extension: quantity demanded rises because the good's own price fell. One scheme also accepts a diagram. Write "an increase in quantity demanded": one scheme refuses "an increase in demand". A contraction is the reverse.
The same idea is set in 5 of the 13 multiple-choice papers. Up the same curve is a contraction, down it an extension; a jump to another curve at the same price is a shift, and options naming one sit beside the right answer. Only the good's own price varies along a curve, so a cost cut that lowers the price causes an extension, while hot weather or advertising shifts the curve.
5. Shifts of the demand curve
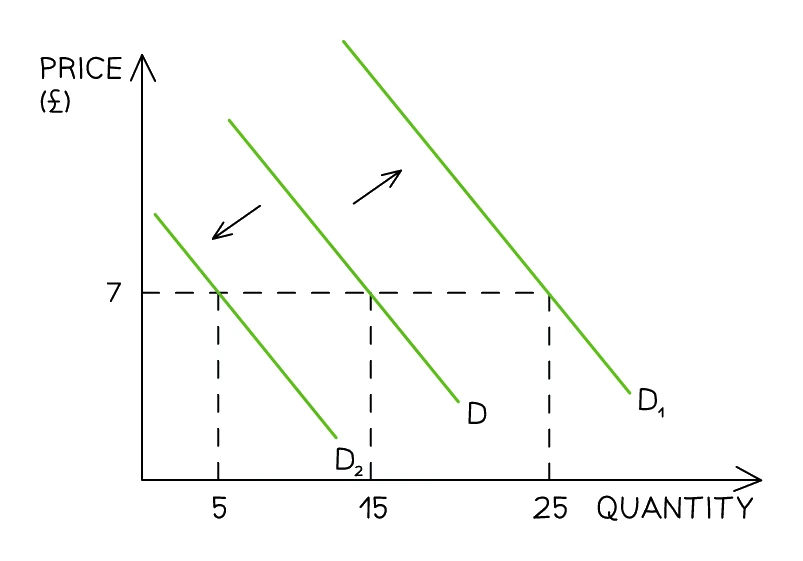
A change in any factor other than the good's own price moves the whole curve sideways. The collective name for these non-price factors is the conditions of .
Increase in demand = a rightward shift to a new curve (D₁ in the figure above). At every price, consumers now want more.
Decrease in demand = a leftward shift to a new curve (D₂ in the figure above). At every price, consumers now want less.
A useful mnemonic: PINET
The syllabus asks for the causes of increases and decreases in demand. The mnemonic PINET packs five of the main ones into one word.
| Letter | Stands for | Effect on demand |
|---|---|---|
| P | Price of related goods | Substitutes: rival's price ↑ → demand for this good ↑. Complements: partner's price ↑ → demand for this good ↓. |
| I | Income | Normal good: income ↑ → demand ↑. Inferior good: income ↑ → demand ↓. |
| N | Number of consumers (population size and structure) | Population ↑ → market demand ↑. Ageing population shifts demand toward goods used by older people. |
| E | Expectations of future prices | Consumers expect prices to rise → buy now → demand ↑ today. Expect prices to fall → wait → demand ↓ today. |
| T | Tastes, fashion and advertising | Successful advertising or a fashion trend → demand ↑. Bad publicity or a fashion moving on → demand ↓. |
Some textbooks use a different mnemonic (PIRATES, JIPSIE, TRAINS). These cover the same non-price factors, but split or order them differently. Memorise whichever mnemonic feels natural and apply it consistently.
The conditions of demand in detail
1. Income. The relationship between income and demand depends on the type of good.
- A has a positive relationship: when income rises, demand rises (cars, restaurant meals, branded clothes). Most goods are normal.
- An has a negative relationship: when income rises, demand falls (supermarket own-brand bread, intercity coach travel where rail and air become affordable). When income falls, demand for inferior goods rises.
2. Price of related goods. Two types:
- Substitutes are goods that can replace each other (tea and coffee, Coca-Cola and Pepsi, Uber and Lyft). When the price of a substitute rises, consumers switch to the other one, so demand for this good rises.
- Complements are goods consumed together (cars and petrol, printers and ink cartridges, game consoles and games). When the price of a complement rises, consumers buy less of the pair overall, so demand for this good falls.
Common exam question
How substitutes and complements affect demand
Question: Explain how a change in a substitute's or a complement's price affects demand for a good, or how the demands for two related goods are linked (4–6 marks).
Asked in 3 of the 11 structured papers. For each good, give the relationship, the direction and the reason. A substitute's price rise makes this good relatively cheaper, so buyers switch and demand increases; a complement's price rise means less of the pair is bought, so demand falls. One scheme caps an answer covering only one kind at 3 of the 4 marks.
Mind what you relate: one good's price against the other's demand is positive for substitutes and negative for complements, while demand against demand is the reverse. Naming two substitutes, or two pairs, is asked in 2 of the 11 structured papers too, a mark each. A substitute's price rise is set in 2 of the 13 multiple-choice papers: it causes an increase in demand, never an extension.
3. Tastes, fashion and advertising. Anything that makes the good more attractive to consumers shifts demand right; anything that makes it less attractive shifts demand left. A successful advertising campaign, a celebrity endorsement, or a positive online trend all raise demand. A health scare, bad press, or a fashion moving on all reduce demand.
Exam tip
Give each good its own direction and cause
When one change, such as better education, is said to affect demand for two goods, take each good in turn: say whether its demand rises or falls, then the condition of demand behind it. Better-informed consumers want less of a harmful product and more of a healthy one, and higher earnings can raise demand for both. The scheme gives one mark per direction and one per explanation, and credits a rise in demand for the harmful product only when it is tied to that higher income.
4. Expectations of future prices. If consumers expect the price of a good to rise in the near future, they buy more now to lock in the lower price, raising current demand. The reverse is also true: expecting a fall in price makes consumers wait, reducing current demand. This is why announced tax rises on cigarettes or alcohol often produce a short-term spike in current demand.
5. Population size and structure. A larger population means more potential buyers and so a larger market demand at every price. Changes in the structure of population (e.g. an ageing population, a baby boom, net inward migration) shift demand for specific goods: more pensioners means more demand for hearing aids and reduced demand for school uniforms.
6. Shift vs movement: the central distinction
| Movement along the demand curve | Shift of the demand curve | |
|---|---|---|
| What changes? | The good's own price | Any non-price factor (income, tastes, related goods, expectations, population, advertising) |
| What does the curve do? | Stays put | Moves to a new position |
| What do we call the change? | Extension (price ↓) or contraction (price ↑) | Increase in demand (rightward) or decrease in demand (leftward) |
| What changes on the diagram? | The point on the curve | The whole curve |
| Vocabulary | "change in quantity demanded" | "change in demand" |
Taxes and subsidies need care here. An indirect tax or a subsidy on a good acts on producers, so it shifts the supply curve. The change in the price consumers then pay causes a movement along the demand curve (a contraction after a tax, an extension after a subsidy), not a shift of it. So an indirect tax or a subsidy on a good is not a condition of demand for that good; both are covered in the Supply and Market equilibrium topics.
7. Individual demand and market demand
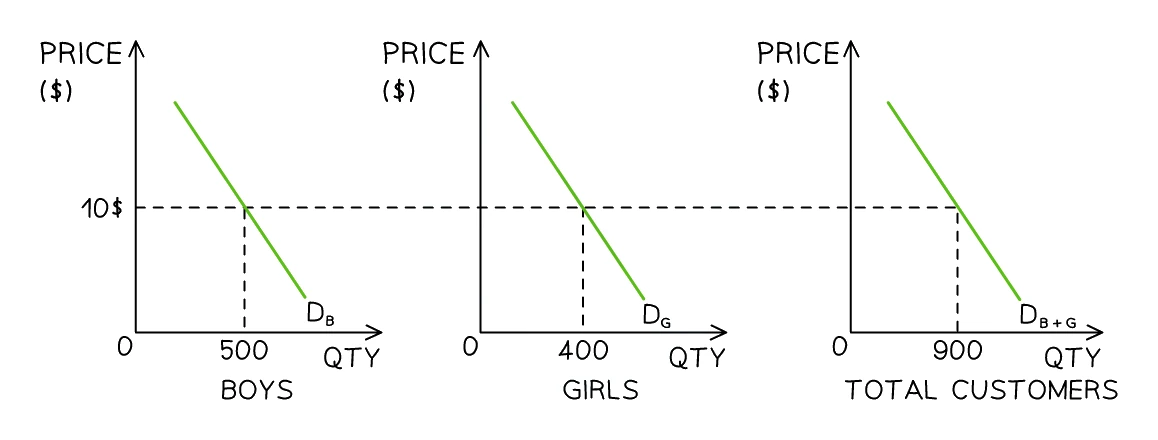
Individual demand is the quantity of a good one consumer is willing and able to buy at each price. Market demand is the sum of all individual demands at each price.
To build the market demand curve, the demand from every consumer is added horizontally (i.e. quantities at each price are added together). For example, if at a price of $10 one group of buyers demands 500 units and another demands 400, market demand is 500 + 400 = 900 units at that price.