1. What this topic covers
Every firm faces the same basic question: do its revenues from selling its product exceed the costs of making it? If yes, the firm makes a and can survive and grow; if no, the firm makes a loss and will eventually leave the market.
This topic looks at:
- the costs a firm pays to produce its output (fixed and variable),
- the revenue it earns from selling that output,
- the profit (or loss) that results,
- how average changes as the firm grows (economies and diseconomies of scale),
- and the objectives a firm's owners set for it.
2. Fixed costs and variable costs
Fixed costs (FC) are costs that stay the same whatever the firm produces. They have to be paid even if output is zero, and they do not rise when output rises.
Variable costs (VC) are costs that change directly with the level of output. They rise as production rises and fall as production falls.
| Type | Definition | Typical examples |
|---|---|---|
| Fixed costs | Independent of output | Rent on premises, business-rate property tax, insurance, loan interest, salaries of permanent staff |
| Variable costs | Move with output | Raw materials, piece-rate wages, packaging, energy used in production, delivery fuel |
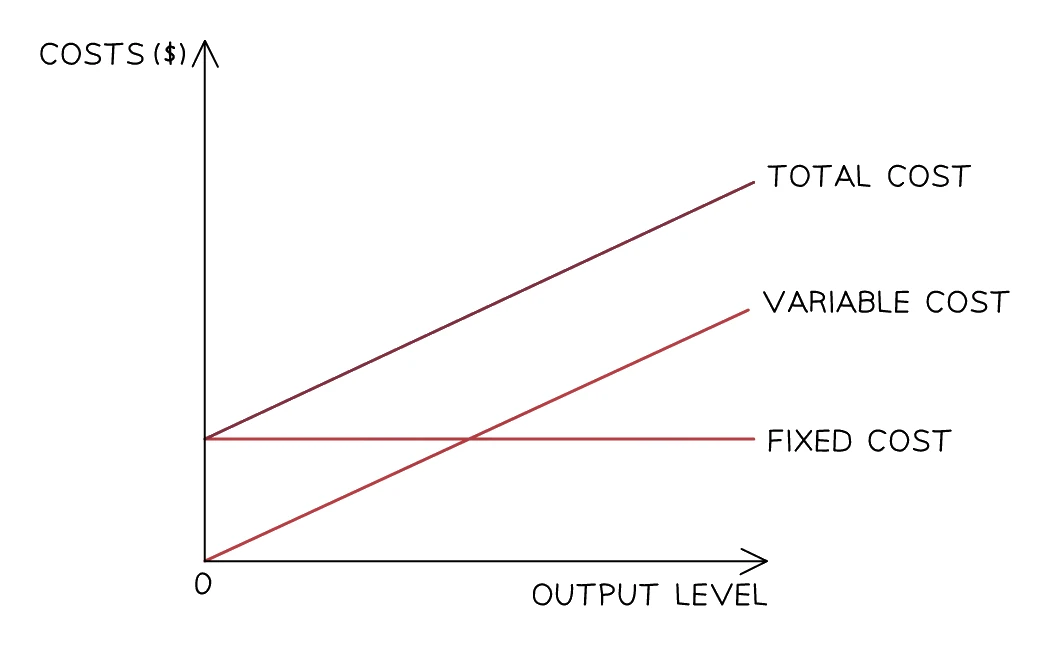
Plotted against output, fixed cost is a horizontal line (unchanged by output), total variable cost rises from the origin, and total cost is the two added together, so it starts at the level of fixed cost and rises parallel to the variable cost line.
Two distinctions worth knowing:
- Wages can be fixed or variable. A permanent salaried manager is a fixed cost (paid the same whether output is high or low). A piece-rate factory worker who is paid per unit produced is a variable cost.
- are a short-run concept. Over the long run, every cost becomes variable (a firm can sell its premises, terminate insurance contracts, repay loans). Here, "fixed" is shorthand for "fixed in the short run".
Do not confuse fixed costs with . Fixed costs still exist in the short run; sunk costs are costs that have already been paid and can never be recovered (e.g. money spent on a market-research report that is now in the firm's drawer).
Common exam question
Defining and spotting fixed and variable costs
Question: Define a fixed cost and give an example (2 marks), or pick out the fixed or the variable cost from four costs (1 mark, multiple choice).
Asked in 1 of the 11 structured papers. One mark is for the meaning: a cost that does not vary as output changes, or one the firm must still pay when it produces nothing. The other is for an example such as rent. Saying only that the cost "does not change" misses the first mark, because it never mentions output.
Set in 3 of the 13 multiple-choice papers. Ask whether each option would rise if the firm made more: raw materials, fuel and overtime pay would, so they are variable; rent, insurance and loan interest would not. The definition scheme accepted electricity bills and wages as examples, yet the item asking for a fixed cost keyed insurance with both among the options, so give rent or insurance.
3. Total cost, average total cost and the cost formulas
Several derived costs follow from FC and VC.
| Concept | Formula |
|---|---|
| Total variable cost (TVC) | Variable cost per unit × Quantity (Q) |
| Total cost (TC) | Total fixed cost (TFC) + Total variable cost (TVC) |
| Average fixed cost (AFC) | TFC ÷ Q |
| Average variable cost (AVC) | TVC ÷ Q |
| Average total cost (ATC) | TC ÷ Q (also AFC + AVC) |
Average total cost is sometimes written AC (average cost) instead of ATC. The two mean exactly the same thing, and both abbreviations are recognised in exam answers.
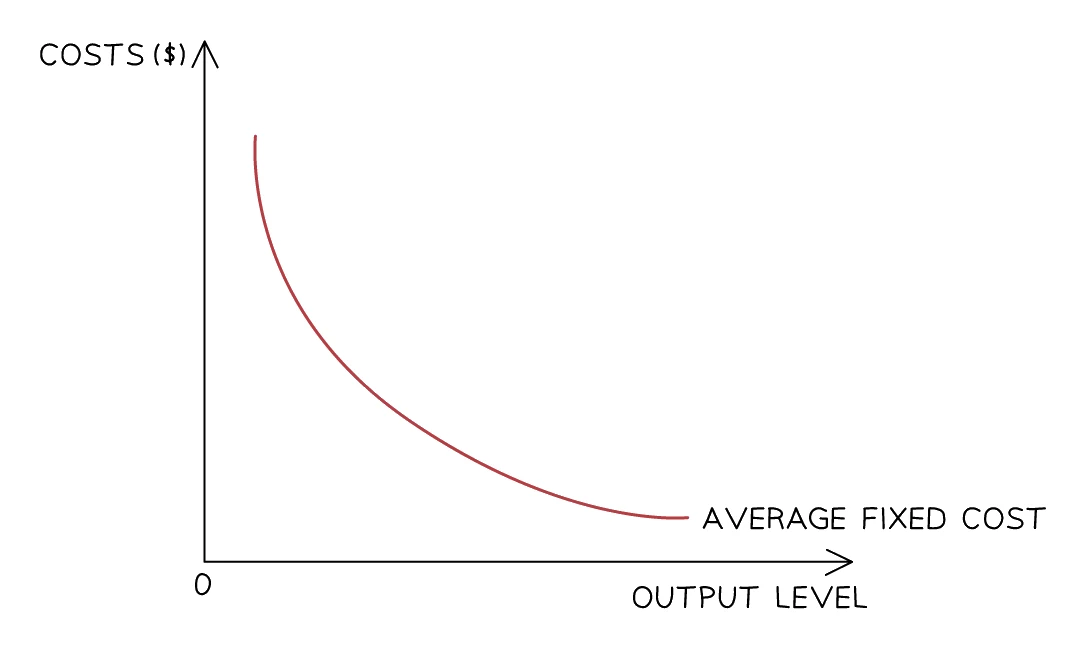
Because a fixed total is spread over more and more units, average fixed cost falls continuously as output rises, steeply at first and then flattening out. This is one reason a firm's average total cost (ATC) tends to fall as it produces more.
Common exam question
Calculating a cost from figures or a graph
Question: Work out average total, fixed or variable cost, or fixed cost, from totals, a table or a total cost graph, or say how average cost is calculated (1 mark, multiple choice).
Set in 7 of the 13 multiple-choice papers. Find the right total, then divide by output. Fixed cost is total cost at zero output, the same at every output; total variable cost is total minus fixed cost. Wrong options reuse the numbers: a total for the average asked for, or another average. Check the units: one table was in thousands.
For the average after one more unit, rebuild the total: four units averaging $15 cost $60, so a fifth costing $20 gives $80 ÷ 5 = $16. For how ATC changes, calculate each value rather than assume a U shape.
Asked in 1 of the 11 structured papers, as a one-mark data part (total cost ÷ number produced); an answer in millions needed at least two decimal places.
Worked example
Calculating TC, ATC, TR and profit from a data set
A firm has fixed costs of $800 per week. It produces 200 units, with a variable cost of $3 per unit. It sells every unit at a price of $8.
Solution:
- Total variable cost (TVC) = $3 × 200 = $600
- Total cost (TC) = TFC + TVC = $800 + $600 = $1,400
- Average total cost (ATC) = TC ÷ Q = $1,400 ÷ 200 = $7 per unit
- Total revenue (TR) = price × quantity sold = $8 × 200 = $1,600
- Profit = TR − TC = $1,600 − $1,400 = $200 profit
Worked example
Finding fixed cost, AFC and AVC from total cost
A print shop's total cost is $450 a week when it prints nothing and $1,650 a week when it prints 300 posters. Calculate its fixed cost, and its average fixed, average variable and average total cost at 300 posters.
Solution:
- Fixed cost = total cost at zero output = $450, and it is still $450 at 300 posters
- Total variable cost (TVC) = TC − FC = $1,650 − $450 = $1,200
- Average fixed cost (AFC) = FC ÷ Q = $450 ÷ 300 = $1.50
- Average variable cost (AVC) = TVC ÷ Q = $1,200 ÷ 300 = $4.00
- Average total cost (ATC) = TC ÷ Q = $1,650 ÷ 300 = $5.50
- Check: AFC + AVC = $1.50 + $4.00 = $5.50, the same as ATC
Keep each average with its own total: $450 is the fixed cost, not the AFC, and $5.50 is the average total cost, not the average variable cost.
4. Total revenue and average revenue
Cost is only half the story. The other half is what the firm gets paid.
Total revenue (TR) = the selling price multiplied by the number of units sold. In short form,
TR = P × Q.Average revenue (AR) =
TR ÷ Q. For a firm selling at a single price, this is the same as the price.
At a given price, total revenue rises in proportion to the number of units sold: selling more units raises TR, and selling fewer lowers it. Taking the firm in the worked example above, which charges $8 a unit:
| Units sold (Q) | Total revenue (P × Q) | Average revenue (TR ÷ Q) |
|---|---|---|
| 200 | $1,600 | $8 |
| 250 | $2,000 | $8 |
| 300 | $2,400 | $8 |
Average revenue stays at $8 in every row because a single price is charged, so the whole change in total revenue comes from the change in quantity sold.
Common exam question
Defining and calculating total and average revenue
Question: Say what revenue is or how it is calculated, or find total revenue, average revenue or price (1 mark, multiple choice); or state how average revenue is found (2 marks).
Set in 5 of the 13 multiple-choice papers. Revenue is what a firm receives from sales: total revenue is price × quantity sold; average revenue, total revenue ÷ quantity, is the price. Wrong options invert the formula, multiply output by costs, or describe profit (the surplus over costs).
So a given AR is the price, not the quantity divided by it. For a change in AR or TR, subtract old from new; do not pick the new value. From a table of AR and sales, multiply each row: total revenue peaked at a far larger output than the one sold at the highest price, then fell.
Asked in 1 of the 11 structured papers: a mark for total revenue, one for dividing by quantity sold ("quantity" alone was accepted).
One qualifier makes this exam-safe: a firm usually has to lower its price to sell more, so higher sales do not automatically mean higher revenue. Whether the extra units outweigh the lower price depends on the price elasticity of demand for the product (covered in topic 7): if demand is price-elastic a price cut raises total revenue, and if demand is price-inelastic a price cut lowers it.
Exam tip
Revenue rises with sales, not with lower costs
Asked why a firm's revenue may rise (a 4-mark structured question: a mark for each of two reasons and one for explaining each), give something that brings in more money: more demand from higher incomes, advertising or a change in taste; dearer or fewer substitutes; cheaper complements; better quality; more market power; a subsidy; or a price change that suits the PED, a rise when demand is inelastic and a cut when it is elastic. Lower costs and higher profits earn nothing, because they change profit, not revenue.
5. Profit, loss and break-even
Profit = (TR) − (TC).
If TR > TC, the firm makes a . If TR < TC, the firm makes a loss. If TR = TC, the firm breaks even.
6. Economies and diseconomies of scale
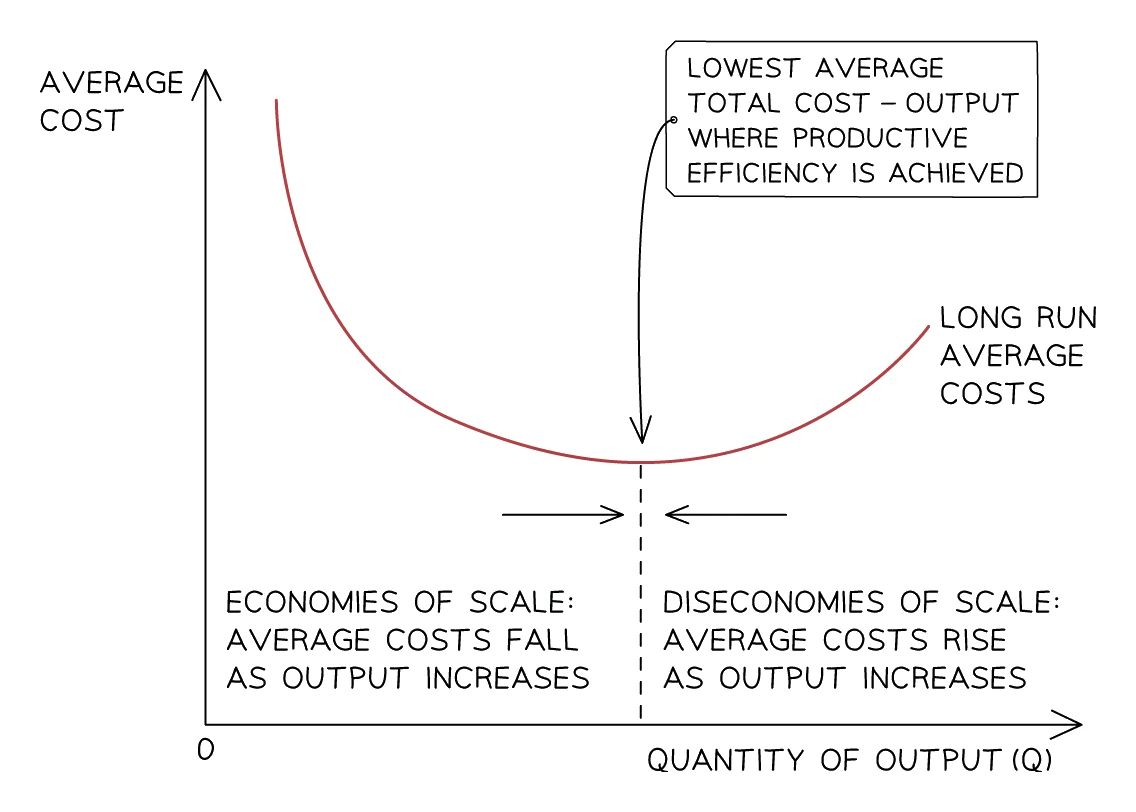
As a firm gets larger, its typically falls for a while and then, beyond some point, starts to rise. Two opposing forces are at work.
Economies of scale are the fall in long-run average cost that a firm enjoys as it grows in size and output.
Diseconomies of scale are the rise in long-run average cost that a firm suffers once it becomes too large to run efficiently.
The point on the long-run average-cost curve where economies stop and diseconomies begin is the lowest point on the curve, where average cost is at its minimum.
Internal economies of scale
These are cost savings the firm captures as it grows. The syllabus asks how internal and external economies and diseconomies of scale affect a firm as its scale of production changes (external ones are covered in topic 24). Six types of internal economy are commonly distinguished, and naming them earns credit.
| Type | What it is |
|---|---|
| Technical | Larger machines, specialised production lines, longer production runs that lower unit cost (e.g. a car assembly line that makes 1,000 cars a day has far lower unit cost than a workshop making 5 a day). |
| Financial | Big firms can borrow at lower interest rates (banks see them as lower risk) and can issue shares; small firms pay more for finance. |
| Marketing | Advertising and branding spread across millions of units of output; the cost per unit sold is tiny. |
| Managerial | Large firms can hire specialist managers for finance, marketing, HR, operations. Small firms often have one owner handling every function without specialist help. |
| Purchasing | Bulk-buying discounts when a firm orders raw materials in huge quantities. |
| Risk-bearing | Large firms diversify across products, markets and regions; a bad year in one area is offset by a good year in another. |
Internal diseconomies of scale
Once a firm grows past the output at which long-run average cost is at its minimum, several problems begin to drive average cost back up.
| Type | What goes wrong |
|---|---|
| Communication | Messages get distorted as they pass through more layers of management; decisions are based on partial or wrong information. |
| Coordination | A huge firm with many factories, departments and divisions struggles to keep everyone working toward the same goal. |
| Motivation | Individual workers feel like a tiny cog in a giant machine; productivity falls. |
| Control | Senior managers cannot oversee everything; sub-divisions develop their own (sometimes inefficient) practices. |
7. Objectives of firms
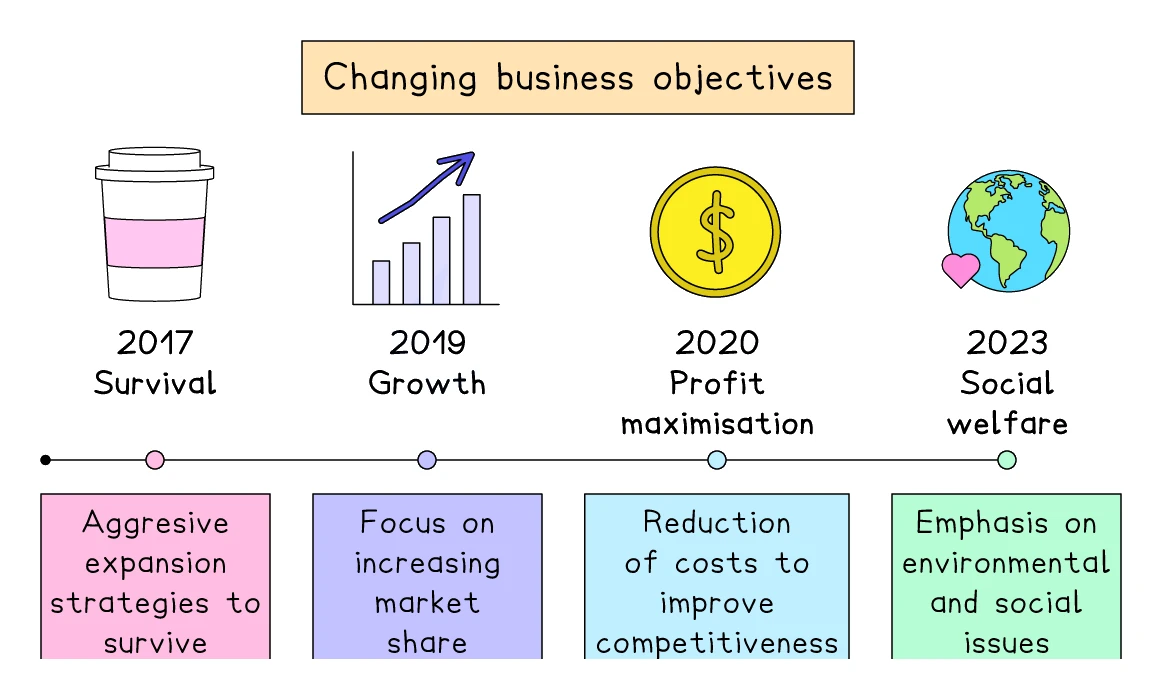
A firm's owners decide what the firm is trying to achieve. The syllabus names four objectives.
| Objective | What the firm prioritises |
|---|---|
| Profit maximisation | Maximising the gap between TR and TC. The textbook "rational" objective and the default for most private firms. |
| Growth | Maximising revenue, market share, or number of employees rather than profit, often to access economies of scale. |
| Survival | Staying in business at all costs. Common for new start-ups and for established firms during recessions. |
| Social welfare | Producing benefits for society or the environment alongside profit. Common for charities, social enterprises and sustainability-focused businesses. |
Common exam question
Identifying a firm's objectives
Question: Identify two objectives a private sector firm may have (2 marks), or pick the objective or definition that fits a given firm (1 mark, multiple choice).
Asked in 1 of the 11 structured papers, a mark for each objective: profit maximisation, growth or higher sales, a bigger market share, survival, improving the environment or social welfare. Naming each one is enough for Identify.
Set in 3 of the 13 multiple-choice papers. Profit maximisation means making as much profit as possible, not more profit than last year. To survive in the long run a firm must be profitable, covering its costs, but it need not grow. A state-owned firm providing a service such as healthcare aims at public satisfaction (social welfare) rather than profit, sales revenue or survival.
Objectives can change over time. A firm might focus on survival in its first year, switch to growth once it is established, then settle into as a mature business. A previously profit-focused firm might switch to social welfare if its owners or shareholders increasingly value sustainability.