1. The vocabulary of ecology
Ecology is the branch of biology that studies how organisms interact with each other and with their environment. The subject has its own set of precise terms, and many exam questions hinge on using them correctly.
Five terms you need to know
| Term | Meaning | Example |
|---|---|---|
| Population | A group of organisms of the same species living in the same area at the same time | All the grey squirrels in Hyde Park |
| Community | All the populations of different species living in the same area at the same time | All the squirrels, robins, oak trees, foxes, worms and mushrooms in Hyde Park |
| Habitat | The place where an organism lives | A woodland; a pond; a coral reef; a damp log |
| Ecosystem | A community of organisms plus the non-living factors of the area, all interacting together | A whole woodland (organisms + soil + climate + light + water) |
| Biosphere | All the ecosystems on Earth combined | The entire global ecosystem |
The progression goes from small to large:
single organism → population → community → ecosystem → biosphere
Ecosystems vary hugely in size. A small ecosystem might be a garden pond; a large one might be the whole of the Sahara Desert.
Common exam question
Defining population, community and ecosystem
Question: State what is meant by the term ecosystem, or pick the statement that describes a community, or the term for all the organisms together with their environment (1 mark).
Asked in 3 of the 23 papers, with the definition of biodiversity set in one more. An ecosystem is the community plus its environment: all the living organisms and the non-living conditions of an area together. A community is all the different species living in the area; add the environment and it becomes an ecosystem, keep only one species and it is a population. The wrong options in the multiple-choice versions are exactly these neighbours: an option listing every biotic and abiotic factor of an area describes an ecosystem, not a community, and a habitat is the place without its organisms. Biodiversity is the variation shown by the organisms in an ecosystem: the number of different species and the abundance of each.
2. Biotic and abiotic factors
Every organism is affected by two kinds of factor in its environment:
- Biotic factors are the living parts of the environment: other organisms.
- Abiotic factors are the non-living parts of the environment: physical and chemical conditions.
Whether a particular species can survive in a given habitat depends on both kinds. A polar bear cannot live in a tropical rainforest, not just because it has no penguins to eat, but because the temperature is too high.
Common abiotic factors
| Factor | Why it matters |
|---|---|
| Light intensity | Plants need light for photosynthesis. Low light limits plant growth, which limits the food available to everything else |
| Temperature | Affects the rate of every enzyme-controlled reaction. Outside an organism's tolerance range, the enzymes denature and cells stop working |
| Water availability | All life needs water for cellular reactions and (in animals) for blood and tissue fluid. Deserts have very little life; rainforests have very dense life |
| Oxygen availability | Aerobic organisms need oxygen for respiration. Important in water (where oxygen is much less abundant than in air) |
| Soil pH | Plants vary in the pH they tolerate. Acid-loving plants (heathers, blueberries) cannot grow in alkaline soil and vice versa |
| Mineral ion availability | Plants need nitrate, magnesium, phosphate and others to build proteins, chlorophyll and DNA |
| Wind speed | Strong winds dry out leaves, knock down small plants, and stop pollen reaching stigmas. Influences plant species at exposed sites |
| Salinity | Salt content of water or soil. Most organisms cannot tolerate sea-water salinity; specialised ones live only in salty habitats |
Common exam question
Naming an abiotic variable to control
Question: Give one or two abiotic variables that should be controlled in the investigation described, or name an abiotic factor that could affect where a plant species grows (1–2 marks).
Asked in 8 of the 23 papers, usually tacked onto a practical from another topic, so what is being tested is whether you know that abiotic means non-living. Name a physical or chemical condition: temperature is on almost every list, and light intensity, pH, carbon dioxide or oxygen concentration, water or humidity, mineral ions, salinity and wind speed all appear. The volume or mass of a material also counts (the volume of buffer, the mass of compost, the volume of milk). Do not name the variable the investigation is changing: when fertiliser was the independent variable, "fertiliser" was ignored. If you are asked to describe how to control one, the marks come in pairs, the variable and the means: temperature with a water bath, pH with a buffer.
Common biotic factors
| Factor | What it does |
|---|---|
| Availability of food | More food → more individuals can survive and reproduce |
| Predation | Predators control the population sizes of their prey species |
| Competition | Members of the same or different species compete for the same resources (food, water, space, mates) |
| Disease | Pathogens can rapidly reduce a population |
| Mutualism | Some species help each other (e.g. bees pollinating flowers in exchange for nectar) |
Case study: red squirrels vs grey squirrels
A famous case study of biotic factors. Native red squirrels lived across Britain for thousands of years. In the 1800s, grey squirrels were introduced from North America. Today red squirrels are confined to small parts of Scotland and a few islands, while greys dominate.
Three biotic factors explain the decline of the red squirrel:
- Competition for food and habitat. Grey squirrels are larger and can eat a wider range of food (including unripe acorns, which reds cannot digest). When the two species share an area, greys outcompete reds for the available food.
- Disease. Grey squirrels carry a virus called squirrelpox. Greys are immune to it; reds are not. Reds catching the virus from grey squirrels usually die within two weeks.
- Habitat preference. Greys do better in mixed broadleaf woodlands (which dominate southern Britain); reds do slightly better in coniferous forests (more common in the Scottish Highlands). This is why reds have hung on in those areas.
This is not an example of natural selection making one species better; it is the introduction of an invasive competitor changing the biotic factors faced by the natives.
3. Biodiversity
Biodiversity is the range and variety of different species of organisms found on Earth, or in a particular ecosystem
A coral reef has very high biodiversity (thousands of species per hectare). An intensive wheat field has very low biodiversity (one main species, plus a few weeds).
Why biodiversity matters
- Stability: ecosystems with high biodiversity are more resilient. If one species is wiped out by disease, other species can fill the gap. In a low-biodiversity system, losing a single species can collapse the whole food web.
- Food security: most food crops are descended from wild varieties. Wild relatives still hold genetic diversity that crop breeders may need in future (e.g. resistance to new diseases).
- Medicine: many drugs were originally discovered in wild plants, fungi or animals. Aspirin came from willow bark; penicillin from a mould; many cancer drugs from rainforest plants.
- Climate: forests, oceans and peat bogs all absorb large amounts of CO₂. Reducing biodiversity (especially through deforestation) accelerates climate change.
- Cultural and recreational value: people enjoy seeing wildlife. Many livelihoods depend on tourism around biodiversity hotspots.
Many human activities reduce biodiversity (covered in topic 16: Human Impact on the Environment): deforestation, pollution, overfishing, climate change, and the introduction of invasive species.
4. Investigating populations: sampling
You cannot count every individual organism in a large area, so ecologists sample: count what is in a small area, then scale up to estimate the whole population.
Quadrats
A quadrat is a square frame, often 0.5 m × 0.5 m or 1 m × 1 m, placed on the ground. You count all the individuals of the species you are interested in inside the quadrat.
Quadrats are mainly used for plants and slow-moving animals (snails, limpets). They are no use for fast animals like birds or mammals, which would run away.
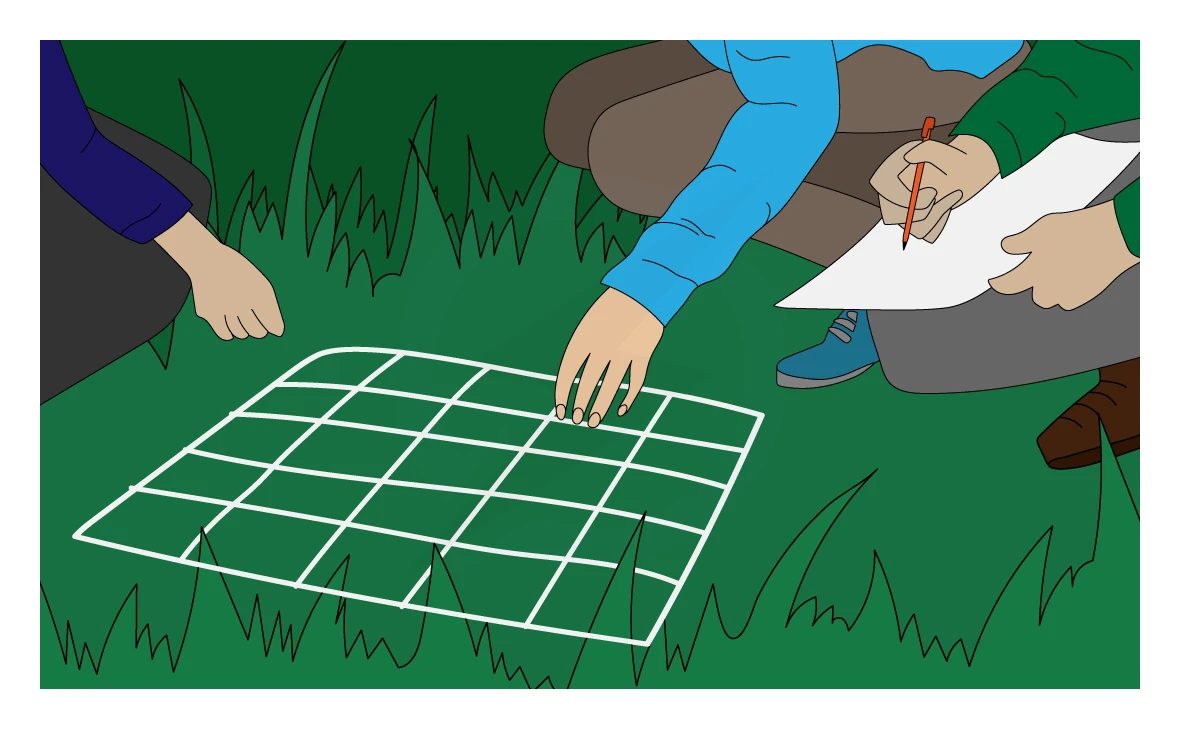
Using a quadrat to estimate population size
- Mark out the area to be sampled (e.g. a 10 m × 10 m square) using two tape measures.
- Place the at a random position by generating two random numbers (one for each coordinate). Random placement is essential: a biased choice of position (e.g. only sunny patches) would give a biased result.
- Count and record the number of individuals of the target species inside the quadrat.
- Repeat at least 10 times at different random positions, and take a mean count per quadrat.
- Calculate the total population using:
estimated total population = (mean count per quadrat) × (total area ÷ area of one quadrat)
Common exam question
Describing how to estimate a plant population with quadrats
Question: Describe how you could find the mean number of a plant species per square metre, estimate its population size in an area, or compare its population in two places (3–4 marks).
Asked in 6 of the 23 papers (a seventh asks why the quadrats go at random and how to improve reliability); the marks are the steps. Use a quadrat (1); place it at random, using random-number coordinates (1); count the individuals of the species inside it (1); repeat and calculate a mean (1); scale up by multiplying by the total area, or divide by the quadrat area for a figure per square metre (1). "Quadrats" in the plural earns the repeat mark as well as the quadrat mark in several schemes; "quadrant" is ignored. Random placement avoids bias and makes the sample representative: "reliable" is ignored as the reason. For a more reliable estimate take more quadrats, not a larger one. In one per-square-metre version, repeating earned nothing.
Two ways to measure with a quadrat
- Count individuals: works well for things like dandelions or daisies that you can clearly count.
- Percentage cover: works for plants like grass, moss or clover that you cannot count individually. Estimate the percentage of the quadrat area covered by the species.
Line transects (showing how a species varies along a gradient)
If a species is not evenly distributed but instead changes along a gradient (e.g. seaweed species change from the high tide line down to the sea), a quadrat placed randomly is not the right tool. Instead use a line transect:
- Lay a tape measure in a straight line across the area, along the gradient (from one extreme to the other).
- At regular intervals along the line (e.g. every 1 m, or every 5 m, depending on the length), place a quadrat.
- Count the species in each quadrat as before.
- Plot the results as a graph of abundance vs distance along the transect.
A line transect is perfect for studying changes from a sunny field edge into a shaded woodland, or from a polluted river bank along the gradient of pollution.
Capture-recapture (for mobile animals)
Quadrats do not work for animals that move (mice, fish, butterflies). Instead use the capture-recapture method:
- Capture a sample of the animals using a humane trap. Count them (let's say you catch n₁ individuals).
- Mark each one (e.g. small dot of paint, plastic tag).
- Release them back into the habitat.
- Wait long enough for the marked animals to mix back in with the rest of the population.
- Capture a second sample (count = n₂). Among them, count how many are marked from the first sample (m).
- Estimate the total population using:
estimated total population = (n₁ × n₂) ÷ m
Assumptions and limitations of capture-recapture
The capture-recapture method only gives an accurate estimate if:
- The population size has not changed between the two captures (no births, deaths, or migration)
- The mark does not harm the animal or make it easier for predators to see
- Marked animals mix back in randomly (don't avoid the traps the second time)
- Sampling is random
In real ecological studies, these assumptions are never perfectly true, but with care the estimate is usually within 10–20% of the true value.
Worked example
Estimating population size from quadrat data
A student counts buttercup plants in 12 randomly placed 1 m × 1 m quadrats across a field that is 60 m × 50 m. The counts are: 4, 7, 3, 6, 5, 8, 4, 6, 5, 7, 4, 5.
Solution:
- Total count across all quadrats = 4 + 7 + 3 + 6 + 5 + 8 + 4 + 6 + 5 + 7 + 4 + 5 = 64
- Mean count per quadrat = 64 ÷ 12 = 5.33 plants per quadrat
- Total field area = 60 × 50 = 3000 m²; each quadrat = 1 m² so the scaling factor = 3000 ÷ 1 = 3000
- Estimated total population = 5.33 × 3000 = ~16 000 buttercup plants
5. Trophic levels and food chains
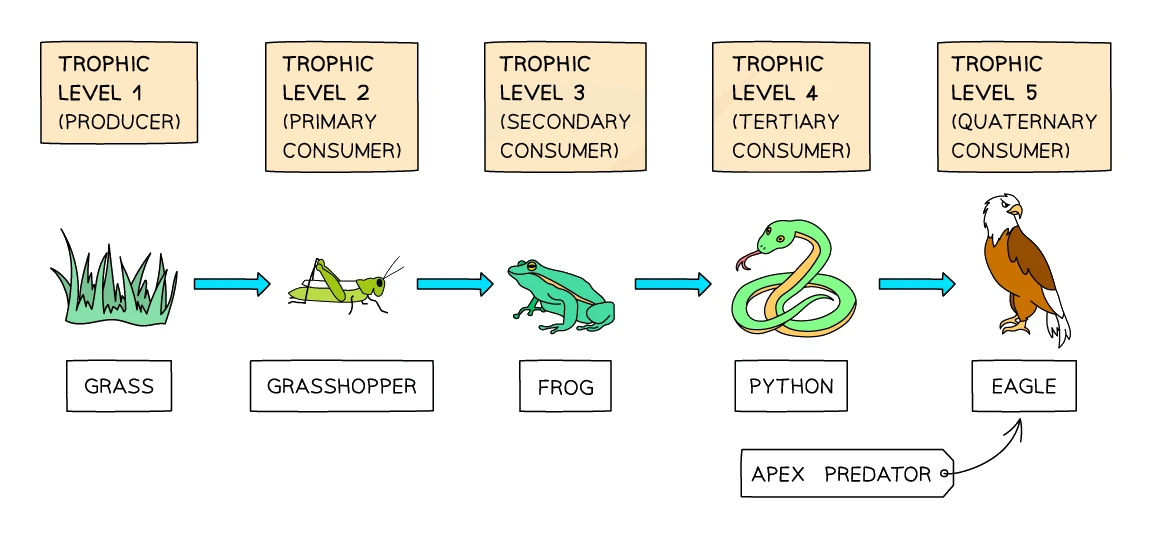
A food chain is a diagram showing the transfer of energy from one organism to the next as one organism eats another. Each step in a food chain is called a .
The trophic levels
| Trophic level | What organisms eat | Examples |
|---|---|---|
| 1st: Producers | Make their own food by photosynthesis, using light energy | Plants, algae, photosynthetic bacteria |
| 2nd: Primary consumers | Eat producers (herbivores) | Cows, caterpillars, rabbits |
| 3rd: Secondary consumers | Eat primary consumers (carnivores or omnivores) | Foxes, frogs, songbirds |
| 4th: Tertiary consumers | Eat secondary consumers (top predators) | Eagles, sharks, lions |
| Decomposers | Feed on dead organisms and waste | Bacteria, fungi, earthworms |
The first trophic level is always a because producers are the only organisms that can convert light energy from the Sun into the chemical energy needed by everything else.
Common exam question
Identifying trophic levels in a food web
Question: Which organism in the food web is the producer, a primary or secondary consumer, or feeds at two trophic levels; or name the trophic level of an organism in a food chain (1 mark each).
Asked in 9 of the 23 papers, almost always as the opening multiple-choice parts of a food-web question. Count the arrows back to the producer: one arrow makes a primary consumer, two a secondary consumer, three a tertiary consumer. An organism reached by routes of different lengths feeds at two levels: a bird that eats both caterpillars and the ladybirds that eat greenfly is a secondary consumer in one chain and a tertiary consumer in the other, the organism these questions ask you to spot. "How many secondary consumers" counts every organism that is two arrows from a producer in any chain. When asked to name a level, "producer" or "first trophic level", and "tertiary consumer" or "fourth trophic level", are both accepted.
Reading a food chain
A typical food chain is written as a sequence of organisms with arrows pointing in the direction of energy transfer:
grass → rabbit → fox
- Grass (1st trophic level, producer) is eaten by the rabbit
- Rabbit (2nd, primary consumer) is eaten by the fox
- Fox (3rd, secondary consumer) is the top of this chain
Arrows point from the eaten organism to the eater (i.e. in the direction energy flows). The arrow means "is eaten by".
Most natural food chains have four at most, because too much energy is lost between levels for a fifth one to be supportable.
Common exam question
Drawing a food chain from a food web
Question: Using the food web, draw a food chain with a stated number of trophic levels, or one that includes a named organism (2 marks).
Set in 3 of the 23 papers. One mark is for the right organisms in the right order, starting from the producer (dead plant material can start the chain when the web shows decomposers feeding on it); the other is for arrows pointing from the eaten organism to the one that eats it. Plain lines, or arrows pointing the wrong way, lose the arrow mark but keep the order mark. Drawing a pyramid instead of a chain scores nothing, and so does a chain that is not taken from the web you were given. Count the organisms before moving on: a five-level chain needs five of them.
Food webs
In any real ecosystem, organisms eat many different things, and most are eaten by many different predators. A food web is a diagram showing the network of all the food chains in an ecosystem. The same organism can occupy different in different chains.
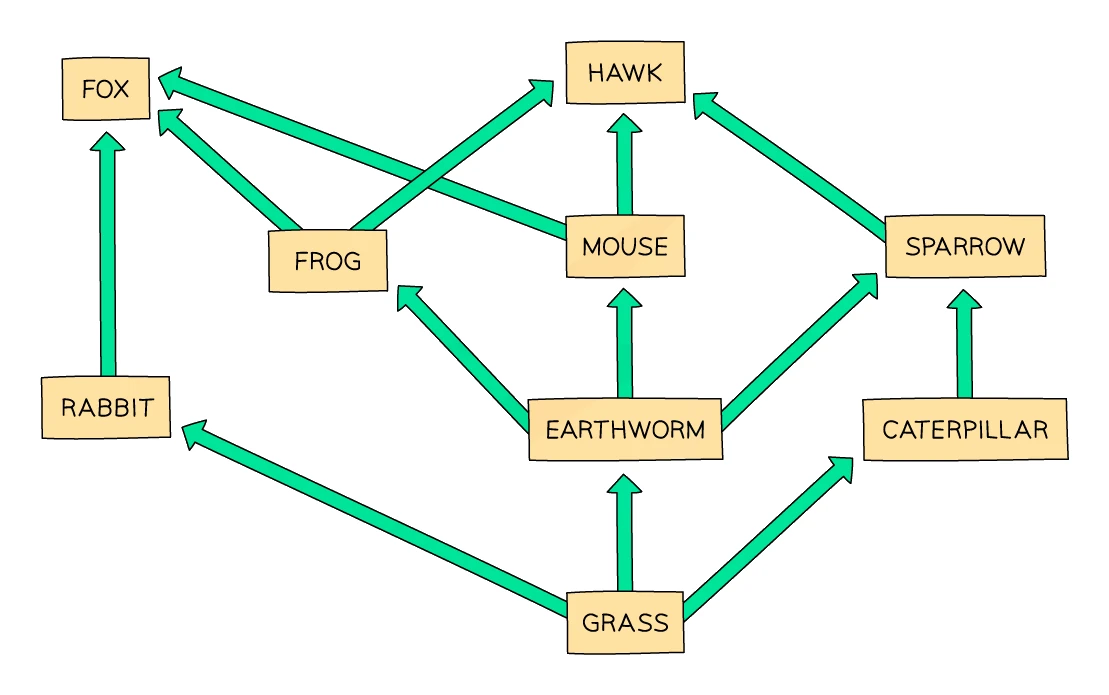
Species removal: knock-on effects in a food web
Removing a species from a food web can affect every other species in it, sometimes dramatically:
- If a predator is removed, its prey species can multiply unchecked, eventually overgrazing the producers and crashing the whole system.
- If a prey species is removed, its predators have less food and decline; species that depended on it for some other role (e.g. seed dispersal) are also affected.
- If a producer is removed (e.g. an invasive species kills all the grass), every herbivore that ate it suffers, and every carnivore that ate the herbivore is hit too.
A well-known example: sea otters in the Pacific eat sea urchins. Sea urchins eat kelp. When sea otters were hunted to near-extinction in the 19th century, sea urchin numbers exploded, the urchins ate all the kelp, and the kelp forests collapsed. Restoring sea otters has restored the kelp.
Common exam question
Explaining the effect of one population's decline on another
Question: Explain what effect a pesticide, hunting or the extinction of one species will have on another organism in the food web (3–4 marks).
Asked in 5 of the 23 papers, once as a multiple-choice question about which organism is least affected. Each population you discuss earns one mark for the direction of change and one for its reason in terms of food or predation: the birds decrease because there are fewer arthropods to eat; the worms increase because fewer of them are eaten. The third mark usually comes from following the web one more link (less food for the ladybirds too, or the birds switching to eat more earthworms). When a predator is lost, say that its prey increases, that the prey eat more plants so the producers fall, and that the other predators then have less food. One of the pesticide questions also credits the pesticide building up in the birds that eat the poisoned insects.
6. Pyramids of numbers, biomass, and energy
Food chains can be drawn as ecological pyramids, where each trophic level is shown as a horizontal bar. The width of the bar represents the amount of something at that level. There are three types of pyramid.
Pyramid of numbers
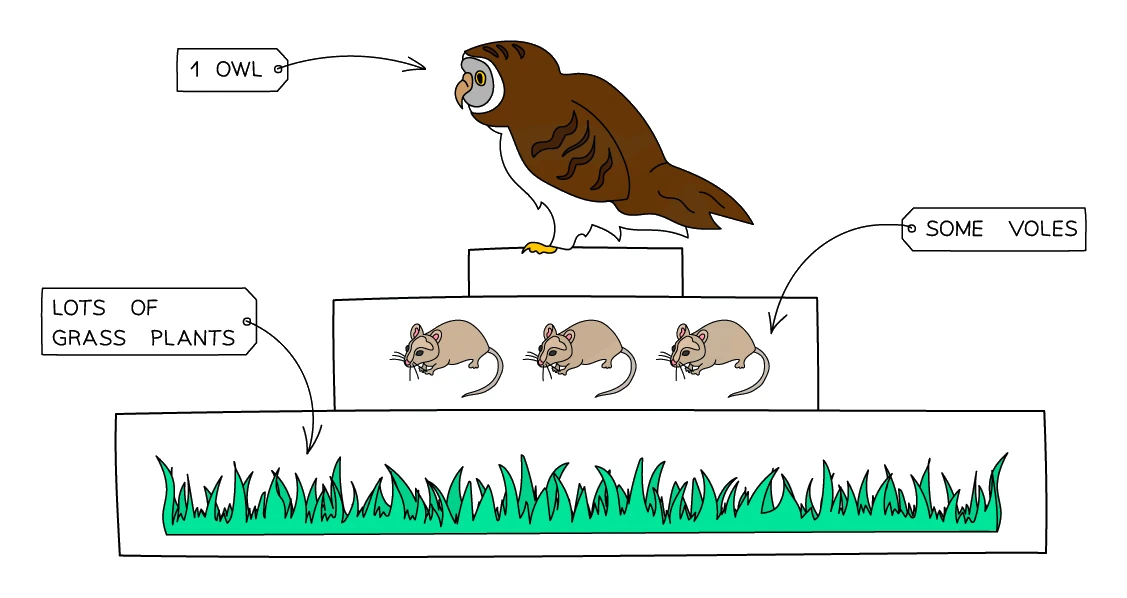
A pyramid of numbers shows how many organisms are at each trophic level. The width of each bar is proportional to the number of individuals.
For most food chains, this gives a true pyramid shape:
grass (millions of plants) → vole (thousands) → owl (few)
But pyramids of numbers are not always pyramid-shaped. If many small organisms feed on one large organism, the producer level is narrower than the consumer level:
oak tree (1) → caterpillar (thousands) → robin (a few) → flea (many)
This gives an awkward shape with a narrow base.
Common exam question
Drawing a pyramid of numbers
Question: Draw a labelled pyramid of numbers for a food chain or for a table of data, sometimes to scale on a grid (2–3 marks).
Set in 2 of the 23 papers. One mark is for the order: the producer bar at the bottom, then primary, secondary and tertiary consumer going up, each bar labelled. One is for a shape that matches the numbers, so one oak tree feeding twenty mice feeding two foxes gives a narrow base, a wide middle and a narrow top, not a triangle. When a grid is provided, the third mark is for bars drawn to scale, and the shape mark there also expects a symmetrical pyramid with every bar the same height (one small square out is allowed).
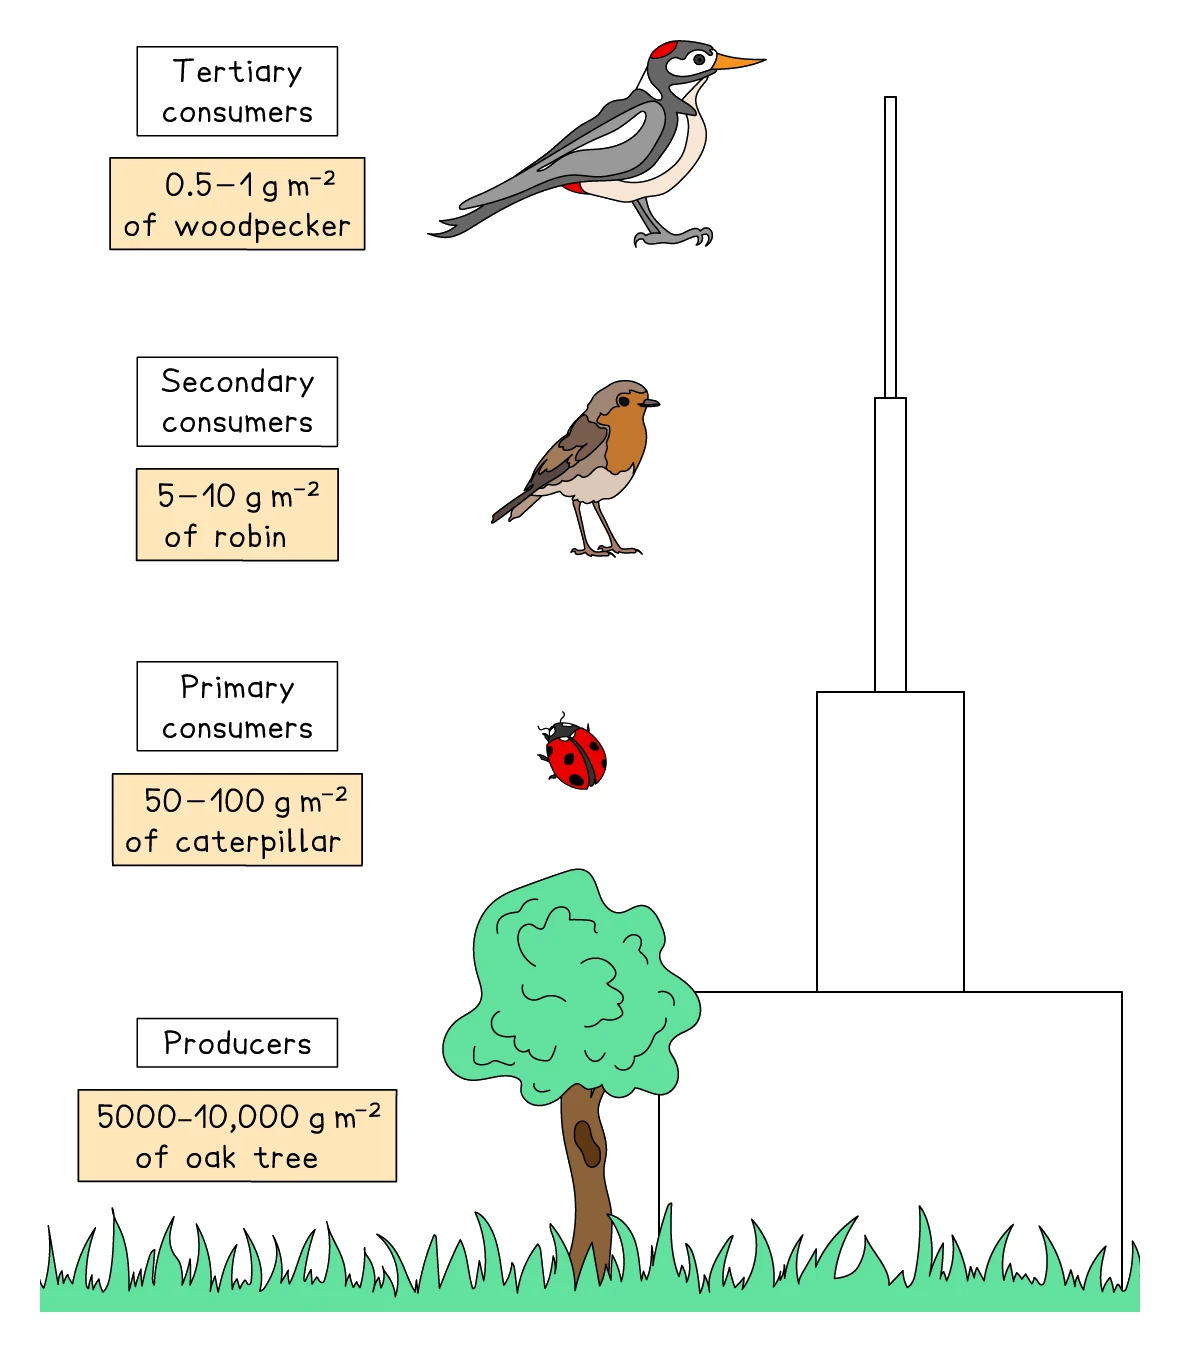
Pyramid of biomass
A pyramid of shows the total mass of living matter at each trophic level (in g/m² or kg per area).
Pyramids of biomass are almost always pyramid-shaped, because the biomass at each level is always less than the level below. The example above looks normal in biomass terms:
oak tree (huge mass) → caterpillars (small mass) → robins (smaller mass) → fleas (tiny mass)
Pyramid of energy
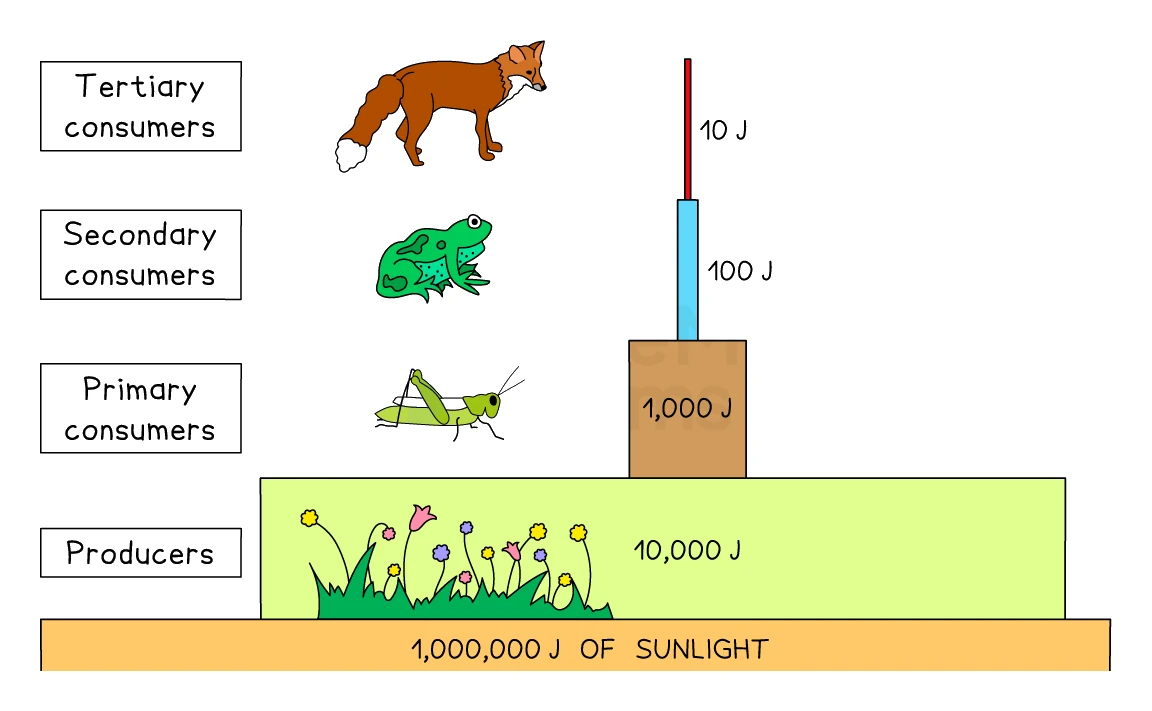
A pyramid of energy shows the energy stored in the biomass at each trophic level (in kJ/m²/year).
Pyramids of energy are always pyramid-shaped. Energy is lost at every level, so there is always less stored energy at higher trophic levels than at lower ones. This is true for every food chain without exception.
Why bigger animals are rarer
The pattern of "many small organisms supporting fewer large ones" appears everywhere because of the energy loss between levels. A square kilometre of grassland can feed thousands of rabbits, but only a few foxes can live off the rabbits. This is why top predators are rare in most ecosystems.
7. Energy transfer along a food chain
Energy enters every ecosystem as sunlight captured by producers. From there it passes through each trophic level by feeding.
The 10% rule
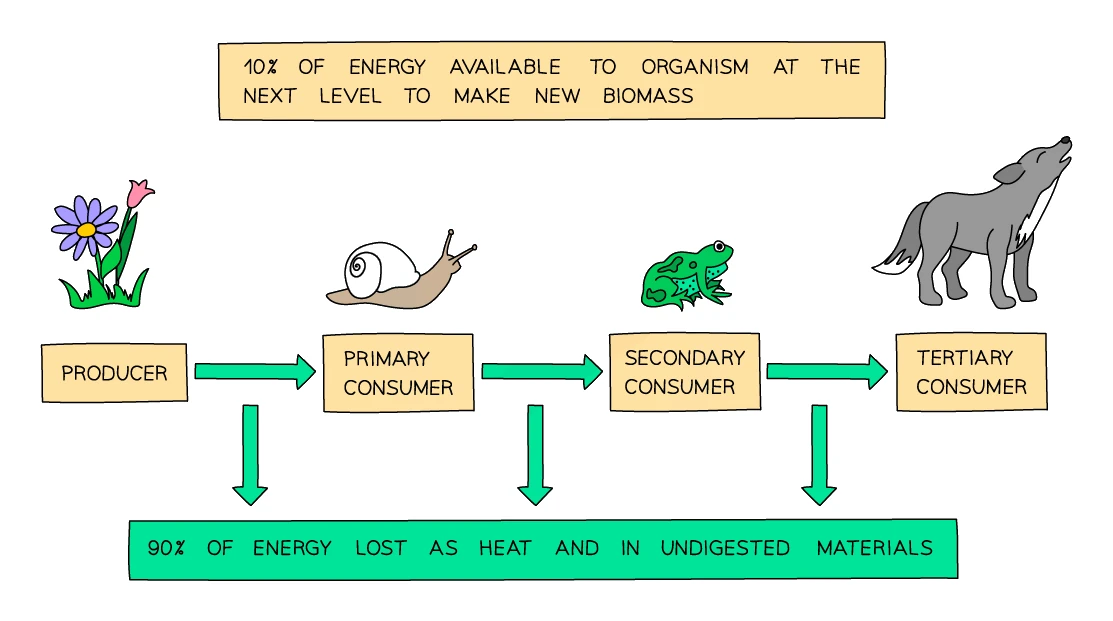
Only about 10% of the energy at one trophic level is transferred to the next. The other ~90% is lost in various ways. This is the famous "10% rule" of ecology, although the actual figure varies between 5% and 20% in real food chains.
Where the lost energy goes
The 90% of energy that does not make it to the next trophic level is lost in several ways:
| Where the energy goes | Why |
|---|---|
| Heat from respiration | Every organism respires constantly, releasing some energy as heat. Warm-blooded animals (mammals, birds) lose a lot here |
| Movement | Energy is used to contract muscles, breathe, pump blood, etc. None of this energy ends up in the consumer that eats them |
| Excretion | Energy in metabolic waste (urea, CO₂) leaves the body in urine and breath |
| Egestion (faeces) | Some food is not digested or absorbed; it passes through the gut unchanged and leaves as faeces. The energy in it goes to decomposers, not to the predator at the next level |
| Uneaten parts | Predators rarely eat everything. Bones, claws, fur, teeth, roots and bark all contain energy that the predator skips |
| Heat lost to surroundings | Especially in mammals and birds that keep a constant body temperature |
Common exam question
Explaining why energy is lost between trophic levels
Question: Explain why only a small proportion of the energy (or biomass) in one trophic level is passed to the next, or why a higher proportion reaches a predator along a shorter food chain (3–4 marks).
Asked in 4 of the 23 papers. Each separate route earns a mark: energy released by respiration and lost as heat, energy used in movement, parts of the organism not eaten, organisms that die and decompose uneaten, undigested food egested in faeces, and urea excreted in urine. "Energy is lost" alone scores nothing in explain questions: say where it goes. Faeces and urine are separate marks, but "excretes faeces" or "excretes undigested food" earns only one of them, so keep egestion and excretion as two sentences. Respiration, heat and movement are sometimes a single mark, so always add the waste routes. When two chains are compared, the first mark is for the shorter chain having fewer transfers, then two routes of loss.
Why food chains are short
Because so much energy is lost at each step, the chain runs out of usable energy after only a few levels. Most food chains end at the third or fourth trophic level. You almost never see a fifth-level predator (something that eats top predators) because there is too little energy left.
Calculating efficiency of energy transfer
The efficiency of energy transfer between two trophic levels is:
percentage efficiency = (energy at higher level ÷ energy at lower level) × 100
The same formula works for biomass, which is closely linked to energy.
Worked example
Calculating the efficiency of energy transfer
In a lake, the energy stored in the producers is 24 000 kJ/m²/year, in the primary consumers 2160 kJ/m²/year and in the secondary consumers 324 kJ/m²/year. Calculate the percentage efficiency of energy transfer from producers to primary consumers and from primary to secondary consumers, and state which transfer is more efficient.
Solution:
- Efficiency = (energy at the higher level ÷ energy at the lower level) × 100
- Producers to primary consumers: 2160 ÷ 24 000 × 100 = 9.0%
- Primary to secondary consumers: 324 ÷ 2160 × 100 = 15.0%
- The transfer from primary to secondary consumers is the more efficient one (15.0% against 9.0%).
A correct answer with no working earns full marks in these calculations, and a rounded or an unrounded value is accepted. If a question gives the percentage instead, work backwards: 6% of 40 000 kJ reaching 30 animals is 2400 kJ shared between them, so 80 kJ each.
Why farming is more efficient if you eat plants
The 10% rule has a practical implication. If 1000 kJ of plant energy is grown:
- Eat the plants yourself → you get ~100 kJ (after digestion losses).
- Feed the plants to cattle and eat the cattle → cattle get ~100 kJ from plants; you get ~10 kJ from cattle.
A vegetarian diet uses far less land, water and energy per person than a meat-based diet. This is why feeding the world's growing population is partly about shifting some meat consumption to plants.
8. Bioaccumulation and biomagnification
When toxic chemicals enter a food chain, they often build up in living tissue rather than being broken down. This causes two related problems:
- Bioaccumulation is the build-up of a toxic chemical inside a single organism over time. The organism absorbs the chemical faster than it can excrete it, so the concentration in its body rises.
- Biomagnification is the increase in concentration of a toxic chemical at successive trophic levels of a food chain. By the time you reach top predators, the concentration may be thousands of times higher than in the water or soil.
How biomagnification works
- A small amount of a toxin (e.g. a pesticide, or a heavy metal like mercury) enters the water or soil.
- Producers absorb it. Each producer ends up with a small dose.
- A herbivore eats many producers, accumulating the doses from all of them.
- A carnivore eats many herbivores, accumulating their doses.
- At each trophic level the concentration in body tissues climbs.
A famous example: DDT and birds of prey
In the 1950s and 60s, the pesticide DDT was used heavily to kill insects on farmland. DDT does not break down easily; it persists in soil and water for decades and dissolves in fat. The chain:
- Water had tiny amounts of DDT (a few parts per billion).
- Plankton absorbed it as they grew.
- Small fish ate plankton and accumulated DDT in their fat.
- Big fish ate small fish, accumulating ever more.
- Birds of prey (ospreys, falcons, bald eagles) ate the big fish, ending up with millions of times higher DDT concentration than the water.
The high DDT levels made the birds lay eggs with thin, fragile shells that broke under the parent's weight. Populations of bald eagles, peregrine falcons and ospreys crashed. After DDT was banned in many countries in the 1970s, these populations have recovered.
Other examples
- Mercury in fish: industrial mercury pollution accumulates in fish. Large predator fish (tuna, swordfish) have higher mercury levels than smaller fish, which is why pregnant women are advised to limit their intake.
- Lead: built up in wildlife from leaded petrol and lead shot, contributing to declines in many bird species. Now mostly phased out.
- PCBs (polychlorinated biphenyls): industrial chemicals that biomagnify; banned in most countries but still persist in the environment.
9. The carbon cycle
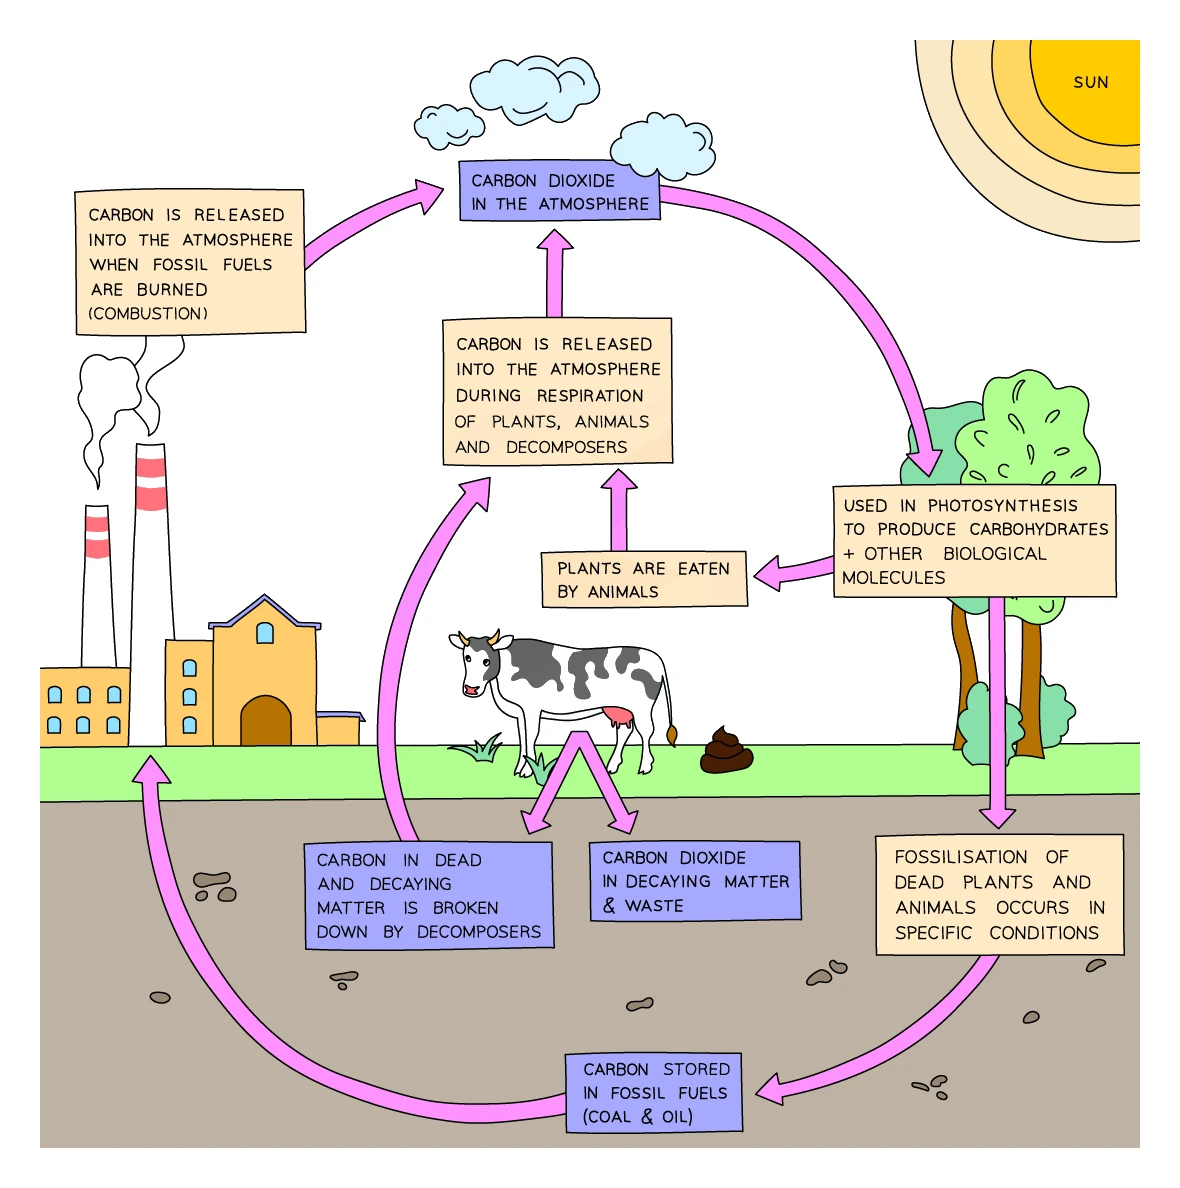
Carbon is the backbone of every biological molecule. Living things constantly move carbon between four major reservoirs: the atmosphere (as CO₂), the bodies of living organisms (as carbohydrates, proteins, lipids, etc.), dead organic matter, and fossil fuels (coal, oil, gas, formed over millions of years from undecomposed organisms).
The four key processes
| Process | What it does | Where it happens |
|---|---|---|
| Photosynthesis | Removes CO₂ from the atmosphere and locks it into glucose (and from there into all the other biological molecules) | In green plants and algae |
| Respiration | Releases CO₂ back into the atmosphere as cells respire | In every living organism, including plants, animals and microorganisms |
| Decomposition | Releases CO₂ from dead organisms and waste material | By bacteria and fungi in the soil |
| Combustion (burning) | Releases CO₂ from fossil fuels or wood by burning | Power stations, vehicles, forest fires |
The full cycle
- Photosynthesis in plants takes CO₂ from the air and uses it to make glucose. Carbon is now inside the plant.
- Plants respire, returning some of the carbon to the atmosphere as CO₂.
- Animals eat plants (or other animals), taking the carbon into their own bodies.
- Animals respire, returning more CO₂ to the atmosphere.
- When plants and animals die, their bodies are broken down by (bacteria and fungi). The decomposers respire too, releasing CO₂.
- If dead organic matter is buried in conditions where decomposers cannot get to it (mud, swamps, deep sediment), the carbon stays locked up. Over millions of years it forms fossil fuels.
- When humans burn fossil fuels (combustion), the carbon that has been locked away for millions of years returns to the atmosphere as CO₂ in a few decades.
Why the carbon cycle matters
For most of Earth's history, the carbon cycle was roughly balanced: photosynthesis removed about as much CO₂ as respiration, decomposition and natural combustion added back. Atmospheric CO₂ levels stayed close to constant.
In the last 250 years, humans have drastically tipped the balance by:
- Burning fossil fuels at a huge rate (releasing fossilised carbon back into the atmosphere)
- Deforestation (which both releases carbon stored in trees and reduces future photosynthesis)
The result is a rise in atmospheric CO₂ from around 280 ppm in 1750 to over 420 ppm today. This extra CO₂ is the main driver of climate change (covered in topic 16).
Common exam question
Naming the processes in a carbon cycle diagram
Question: Name the cycle, name the process shown by a lettered arrow, or pick the letter that represents respiration (1 mark each).
Set in 2 of the 23 papers. Read each arrow by where it starts and where it ends. The one arrow out of the atmosphere, into plants, is photosynthesis. Arrows into the atmosphere from plants, animals and decaying organisms are respiration; the arrow from a factory, a vehicle or burning fuel is combustion. Arrows from plants to animals are feeding (consumption), and arrows from living things to dead organic matter are death. The group of organisms responsible for decomposition is bacteria or fungi, and the cycle itself is simply "the carbon cycle".
10. The nitrogen cycle
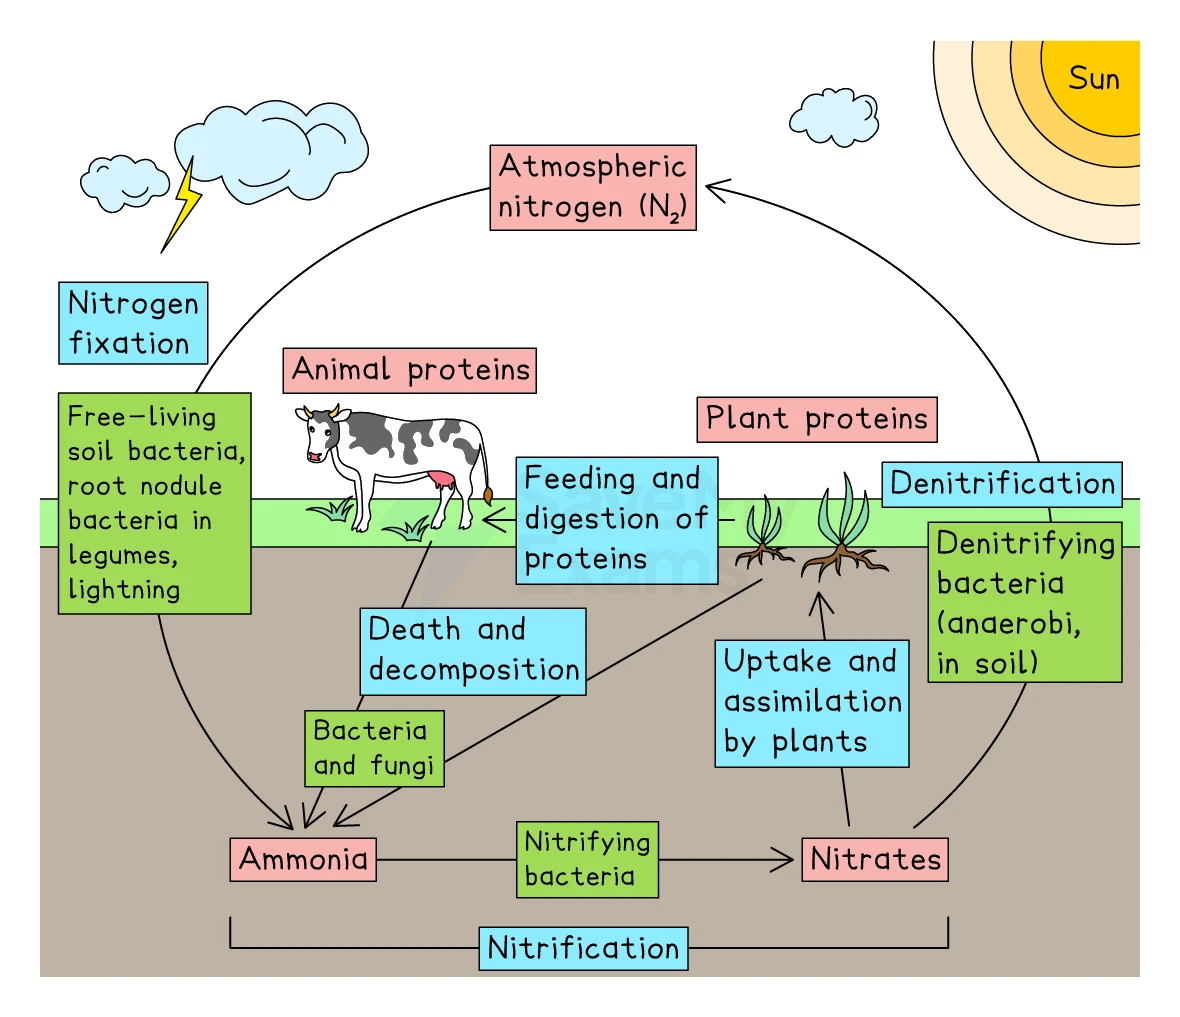
Nitrogen is needed by every living thing to make proteins (and DNA, which contains nitrogen-rich bases). The atmosphere is 78% nitrogen gas (N₂), but this form is chemically unreactive and most organisms cannot use it directly. The nitrogen cycle shows how nitrogen is converted into usable forms and back again.
The four key processes
| Process | What it does | Carried out by |
|---|---|---|
| Nitrogen fixation | Converts N₂ from the air into ammonium (NH₄⁺) and then nitrate ions (NO₃⁻) that plants can use | Nitrogen-fixing bacteria in soil and in legume root nodules; also lightning; also industrial fertiliser production |
| Nitrification | Converts ammonia (from decomposition) into nitrites, then into nitrates | Nitrifying bacteria in the soil |
| Decomposition (ammonification) | Breaks down nitrogen-containing waste (urea, dead bodies) into ammonia in the soil | Decomposers (bacteria and fungi) |
| Denitrification | Converts nitrates in the soil back to N₂ gas, releasing it to the atmosphere | Denitrifying bacteria, in anaerobic conditions (waterlogged soil) |
The full cycle
- N₂ gas in the atmosphere is converted to nitrate in the soil by nitrogen-fixing bacteria. These bacteria come in two main types:
- Free-living bacteria in the soil (e.g. Azotobacter)
- Mutualistic bacteria (e.g. Rhizobium) living in root nodules of leguminous plants (peas, beans, clover, lentils). These plants make excellent crops in rotation because they enrich the soil with nitrogen.
- Plants absorb nitrate from the soil through their roots by active transport.
- Plants use the nitrate to build amino acids and then proteins.
- Animals eat plants (or other animals), taking nitrogen-containing molecules into their own bodies and building their own proteins from them.
- Animals excrete nitrogenous waste (mostly urea) and eventually die.
- (bacteria and fungi) break down dead bodies and waste, releasing ammonia into the soil.
- Nitrifying bacteria convert ammonia → nitrites → nitrates, returning the nitrogen to a form plants can use.
- In waterlogged or compacted soils, denitrifying bacteria convert nitrates back into N₂ gas that returns to the atmosphere.
Named bacteria you should know
| Group | Job | Example |
|---|---|---|
| Nitrogen-fixing bacteria | Fix N₂ gas from the air into ammonium/nitrate compounds | Rhizobium (in legume root nodules), Azotobacter (free-living) |
| Nitrifying bacteria | Convert ammonia into nitrites then nitrates | Nitrosomonas (ammonia → nitrite), Nitrobacter (nitrite → nitrate) |
| Denitrifying bacteria | Convert nitrates back to N₂ gas | Pseudomonas |
Why farmers manage the nitrogen cycle
Crops remove nitrogen from the soil with every harvest. If farmers do nothing, the soil eventually runs out of nitrogen and crop yields fall. Solutions include:
- Adding fertiliser that contains nitrate ions (industrially fixed nitrogen)
- Crop rotation with legumes, which restore nitrogen via their root-nodule bacteria
- Ploughing waterlogged fields to introduce oxygen and reduce denitrification (denitrifying bacteria need anaerobic conditions)
- Spreading manure, which decomposers convert to ammonia and then nitrate
Common exam question
Naming the processes and bacteria of the nitrogen cycle
Question: Name the processes (or the bacteria) labelled on a nitrogen cycle diagram, or describe how ammonia from waste is converted into nitrates (1 mark per label, 2–3 for a description).
Asked in 6 of the 23 papers, all on Paper 2. Match the arrow to its conversion: nitrogen fixation turns nitrogen gas into ammonium or nitrates (nitrogen-fixing bacteria); nitrification turns ammonium into nitrite and then nitrate (nitrifying bacteria); denitrification turns nitrates back into nitrogen gas (denitrifying bacteria); decomposition of protein and urea releases ammonia (decomposer bacteria and fungi). Naming either the process or its bacteria earns the mark. For the description, write both nitrification steps: one scheme ignores "ammonium to nitrate" because it skips nitrite, and gives that mark only for ammonium to nitrite or nitrite to nitrate. The multiple-choice distractors are the three other groups: decomposers release ammonia, denitrifying bacteria remove nitrates, and nitrogen-fixing bacteria do not make them from ammonium.
11. Decomposition
Decomposition is the breakdown of dead organic matter and waste by organisms (mainly bacteria and fungi). Decomposition is what recycles the carbon and nitrogen tied up in dead bodies back into the soil and atmosphere, where they can be used by new organisms.
Without decomposers:
- Dead bodies would pile up
- The minerals (especially nitrogen) inside them would never be released back to the soil
- Plants would run out of nitrate within a few years and growth would collapse
- The entire ecosystem would grind to a halt within a generation
Factors that affect the rate of decomposition
Like all enzyme-controlled processes (decomposers digest their food using extracellular enzymes), decomposition is sensitive to environmental conditions:
| Factor | Effect | Why |
|---|---|---|
| Temperature | Optimum around 25 °C. Faster as temperature rises towards this; slower in cold; stops below freezing. Denatures decomposer enzymes above ~45 °C | Higher kinetic energy speeds up enzyme-controlled digestion. Outside the optimum range enzymes work slowly or denature |
| Water availability | Faster in moist conditions | Decomposers need water for their enzymes to work, and for soluble products to be absorbed. Bone-dry conditions stop decomposition. Mummified bodies in deserts can stay intact for thousands of years |
| Oxygen availability | Faster with oxygen present | Most decomposers respire aerobically. In waterlogged or compacted soils, decomposition is slow and incomplete. This is how peat bogs preserve dead bodies for thousands of years |
| pH | Optimum near pH 7 (neutral) | Decomposer enzymes work best at neutral pH. Acidic soils (e.g. peat) slow decomposition |
| Decomposer abundance | More decomposers = faster rate | A compost heap with plenty of bacteria and fungi works much faster than a pile of leaves on a forest floor |
Designing an investigation of decomposition
A typical experiment to investigate factors affecting decomposition rate:
- Choose an organic substance to decompose (leaf litter, apple slices, slices of bread, cotton fabric). Make sure each replicate has the same starting mass.
- Set up several samples in identical containers, each with different conditions for the variable being tested:
- Different temperatures (fridge at 4 °C, room temperature at 20 °C, incubator at 30 °C)
- Different moisture levels (dry, damp, soaked)
- Different oxygen levels (open container vs sealed container, optionally with water cover to exclude air)
- Leave for a fixed time (a few days for fast-decomposing substances, longer for slower ones).
- Re-weigh each sample. The greater the mass loss, the faster the decomposition.
- Repeat several times and take a mean to reduce error.
Applying CORMS
For an investigation into the effect of temperature on decomposition:
- C (change): the temperature of incubation
- O (organism): same species and amount of dead organic matter
- R (repeat): at least three replicates at each temperature
- M (measure): the change in dry mass of the sample after a fixed time
- S (same): control moisture, light, container size, and how the samples are handled
Real-world applications
- Compost heaps are designed to maximise decomposition: garden waste is mixed with kitchen scraps, kept moist, and turned regularly to introduce oxygen. A well-managed heap reaches 60 °C and breaks down material in weeks.
- Sewage treatment uses controlled decomposition by microbes in aeration tanks to break down organic waste into safe products.
- Refrigeration slows decomposition by lowering temperature, which is why food keeps longer in a fridge.
- Freezing stops decomposition entirely (water is needed for enzymes; ice is not available water).
- Drying and salting stop decomposition by removing water. This is why beef jerky and salted fish keep without refrigeration.