Inflation: Causes & Effects
Government and the Macroeconomy · 4 question types
The syllabus splits inflation into two types according to its underlying cause.
Demand-pull inflation
Demand-pull inflation is caused by excessive aggregate demand in the economy, meaning too much total spending relative to what the economy can produce. Often summarised as "too much money chasing too few goods".
When aggregate demand (AD) rises faster than aggregate supply (AS), firms cannot ramp up output quickly enough to meet the extra spending. They respond by raising prices to ration their limited output to the most willing buyers.
Typical causes of rising AD:
- Cuts in interest rates that lower the cost of borrowing for households and firms.
- Tax cuts that leave households with more disposable income.
- Higher government spending on infrastructure, public services, or transfers.
- A consumer or housing boom in which households spend more out of confidence.
- Higher exports triggered by strong demand abroad.
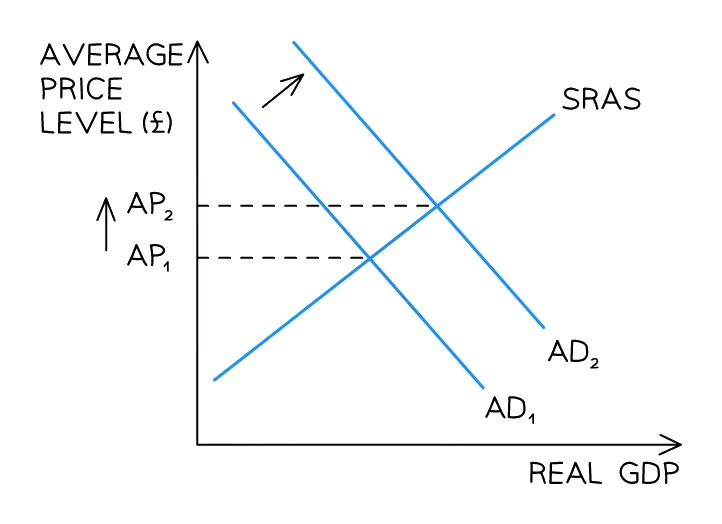
On an AD-AS diagram, demand-pull inflation appears as the AD curve shifting right (AD₁ to AD₂) against a fixed SRAS curve, raising the average price level from AP₁ to AP₂ and increasing real GDP.
Cost-push inflation
Cost-push inflation is caused by rising costs of production (such as higher wages, raw-material prices, or import prices) that firms pass on to consumers as higher prices.
The mechanism: firms see their per-unit cost rise; to keep profit margins acceptable, they raise selling prices. Households and other firms then pay more for everything that uses those inputs.
Typical causes of rising costs:
- A rise in world oil or gas prices that flows through every transport- and energy-using industry.
- Wage rises that exceed productivity gains (sometimes called wage-push ).
- A fall in the exchange rate that raises the price of imported raw materials ().
- A rise in indirect taxes (e.g. VAT, fuel duty) that producers add to retail prices.
- A supply shock: a war, disaster or pandemic that disrupts supply chains.
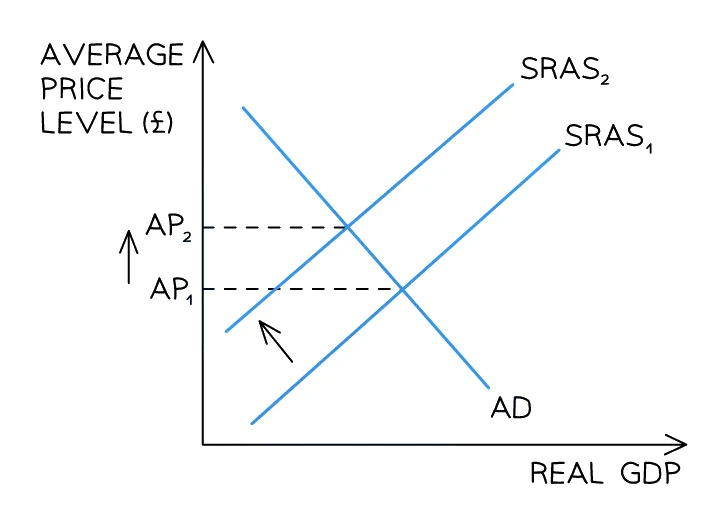
On an AD-AS diagram, cost-push inflation appears as the (short-run) AS curve shifting left (SRAS₁ to SRAS₂) against a fixed AD curve, raising the average price level from AP₁ to AP₂ but reducing real GDP at the same time (called when severe).
Demand-pull vs cost-push at a glance
| Demand-pull | Cost-push | |
|---|---|---|
| Underlying driver | Too much spending (high AD) | Higher production costs |
| What happens to AD/AS | AD shifts right | AS shifts left |
| Effect on real GDP | Rises | Falls |
| Effect on employment | Rises (more output, more jobs) | Falls (firms cut output) |
| Typical real-world trigger | Tax cut, rate cut, export boom | Oil-price spike, weak currency, wage surge |
Types of inflation
Naming and explaining the type of inflation comes up (2–4 marks), so you need to know: demand-pull = aggregate demand rising faster than supply (the spending side); cost-push = rising production costs passed on as higher prices (the cost side). Don't swap the direction — demand-pull comes from spending, cost-push from costs.